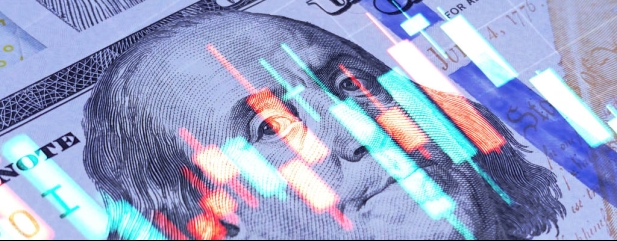
This column has no desire to be seen as a broken clock, stuck and chiming at the same time each day, but it remains convinced that the only chart that matters right now in financial markets is the one that shows the yield on the US 10-year Treasury, or government bond.
The US 10-year’s vertiginous rise seems to be in abeyance for now, presumably as a result of investors’ search for a haven while they watch events in the Middle East and wonder what the implications are, from the narrow perspective of asset prices. This halt in the 10-year yield is welcome (even if the reasons for it are dreadful and a speedy, peaceful resolution to the Gaza conflict would be cheered by all) but there are three reasons for its advance and three reasons why it matters so much. Investors need to keep a close eye on them all.
Yield of dreams
The acceleration in the US 10-year yield since spring looks to have its origins in three trends.
It is not certain that inflation is cooling. The US headline rate crept higher in July and August to 3.7% and oil prices had already risen sharply before the latest round of conflict between Hamas and Israel.
This in turn prompted Federal Reserve chair Jerome Powell to assert that interest rates could stay higher for longer to ensure that inflation was beaten back toward the US central bank’s 2% target.
US Federal debt continues to mushroom. Government borrowing has increased by $1.6 trillion since April’s debt deal, to take the total to $33 trillion. The rate of increase, fuelled by higher spending and sagging tax income, means that the US will need to sell more Treasuries to fund its debts. Worse, America needs to refinance around $15 to $17 trillion of its existing debt in the next two years.
Worse still, the US Federal Reserve is no longer acting as the price-blind buyer of last resort, since it has ended its quantitative easing bond-buying scheme and started to run a quantitative tightening programme, whereby it does not reinvest the proceeds as bond holdings mature.
This is a painful combination. Any signs of these trends going into reverse could therefore put a lid on the benchmark 10-year yield, and, at some stage, investors will presumably decide yields have reached such a level that they are just too tempting to ignore, as they more than compensate for the evident risks on offer.
The colour of money
The future trend in the US 10-year yield matters for three reasons, especially bearing in mind that the US 10-year yield bottomed at 0.51% in August 2020. Since then, the US 10-year bond index has fallen by 29% (since yields and prices have the same inverse relationship for bonds as they do for equities).
The US Federal Deposit Insurance Corporation (FDIC) reports that, as of the end of June, American banks are sat on $311 billion on unrealised losses on held-to-maturity securities. The good news is accounting rules mean they do no longer have to mark-to-market and book those losses each quarter. The bad is that any unexpected run on deposits could force banks to liquidate to raise cash, thus crystallising those losses (rather as happened at Silicon Valley Bank in the spring).
If the banks can hold the securities – which include a lot of US Treasuries – until maturity, then all may be well, but these potential losses are sitting in plain sight and so are the risks. The share prices of US banks are paying attention to the dangers.
The US 10-year is the risk-free rate against which returns from all other assets are judged. The US will not default, and it will pay the coupons. Any other investment must provide a higher return to compensate for the additional risks. The easiest way to get a higher return is to pay a lower price, so rising yields could yet weigh on valuations elsewhere (even if US equities are proving very resilient).
America’s huge debts mean it cannot afford a sustained increase in their cost. The US government’s annualised interest bill is running at $1 trillion, when total tax income is only $5 trillion (and that is when the economy is doing well), while a modest slowdown in debt growth in 2007-09 resulted in near disaster. These numbers speak against rates staying higher for longer and a quick look at the history of the Fed Funds rate also suggests it is unlikely.
That suggests rates may come down quicker than markets currently think. It is tempting to view that as good for equities (as lower yields will reduce the relative attractions of cash and bonds). But perhaps we need to be careful what we wish for. If history is any guide, the Fed will cut when the markets or the economy can take no more, but lower Fed rates did little to support falling share prices during the 2000-03 and 2007-09 bear markets as earnings downgrades outweighed and outpaced lower rates.
‹ Previous2023-10-19Next ›
 magazine