Archived article
Please note that tax, investment, pension and ISA rules can change and the information and any views contained in this article may now be inaccurate.
 magazine
Why are government bond and share prices both rising?

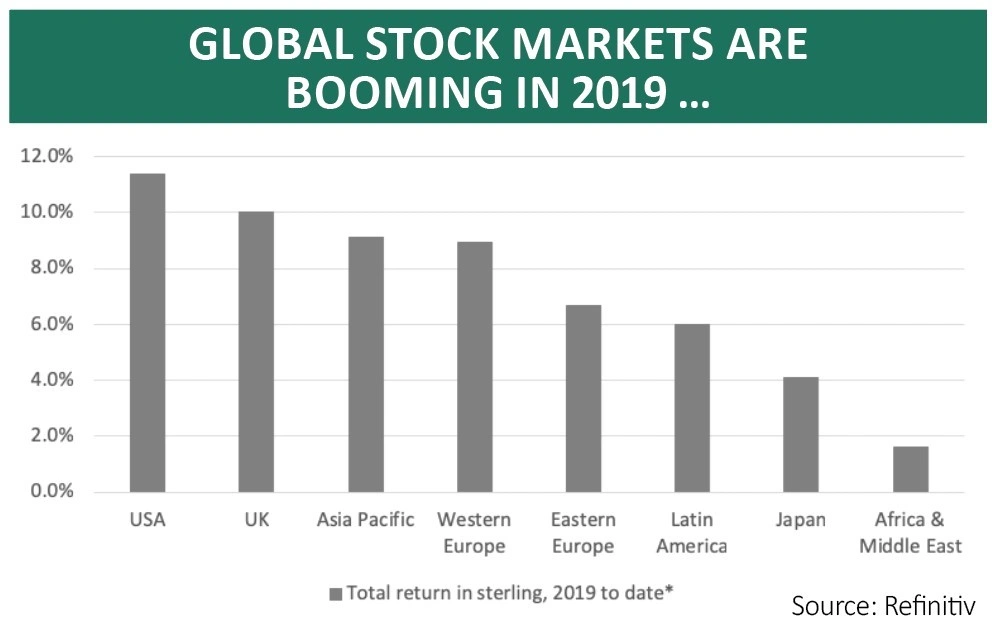
Well here’s a funny thing. On one hand, global stock markets are casting aside the gloom that characterised late 2018 and are off to the races once more. All eight of the major geographic options available to investors have generated positive total returns in sterling terms so far in 2019 (compared to just two – Eastern Europe and the US) across the whole of last year.
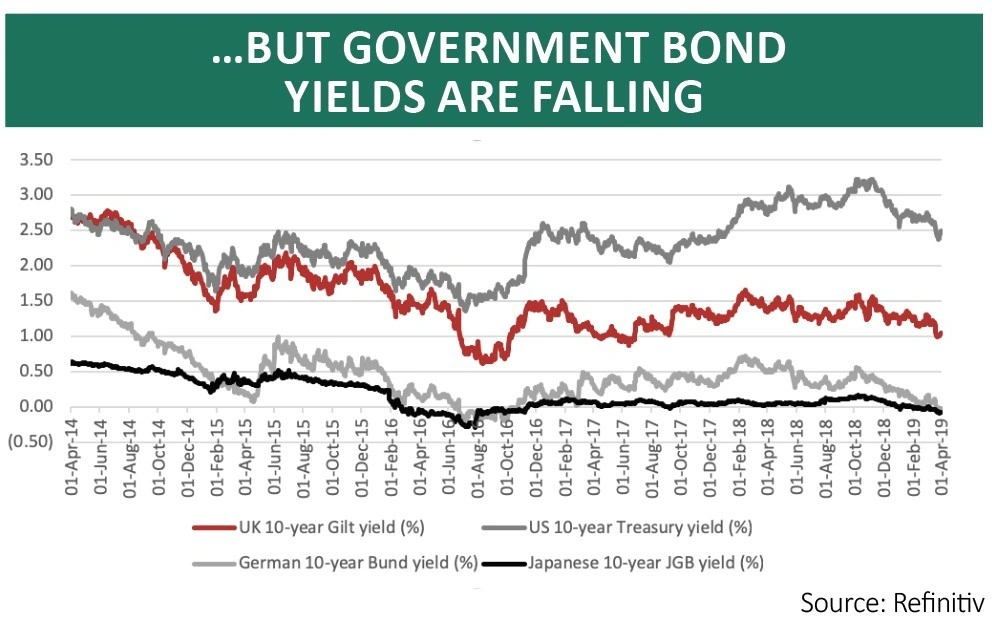
But on the other hand, global government bond prices are also rising which means yields are in retreat. The graphic below shows that the yield on 10-year German and Japanese government paper is back in negative territory. Meanwhile the UK 10-year Gilt yield is back at the 1% mark for the first time since summer 2017 and the US 10-year Treasury yield is hovering around 2.5%, a level last seen just before Christmas 2017.
Granted, the total returns on government bonds are nowhere near as racy as those served up by equities, with a global index of investment-grade sovereign debt having gained 1.2% in the first three months of 2019 in sterling terms (with a gain in the pound having weighed slightly on the outcome).
But this still looks odd, with stocks advancing so smartly yet bond yields retreating so quickly at the same time. This seems inherently contradictory, with stocks seemingly pricing in a robust economic environment and healthy earnings growth and bonds taking a gloomier outlook, factoring in a pause in central bank activity as the monetary authorities respond to the weak economic data that predominated in late 2018 and early 2019.
MIXED MESSAGES
The deeper you dig, the better the news seems to get from January to March 2019. According to data from Bloomberg, America’s S&P 500 stock index generated its best quarterly gains since the third quarter of 2009. In addition, oil made its fastest three-month advance since 2002.
And it was not just government bonds that did well. US investment-grade corporate bonds have just offered their best total returns in a calendar quarter since 1995 and sub-investment grade company paper (or high yield or junk debt) had its best three-month period since 2002.
On top of all of that, there seems to be very little fear about, even if the performance of haven assets such as government bonds would suggest otherwise.
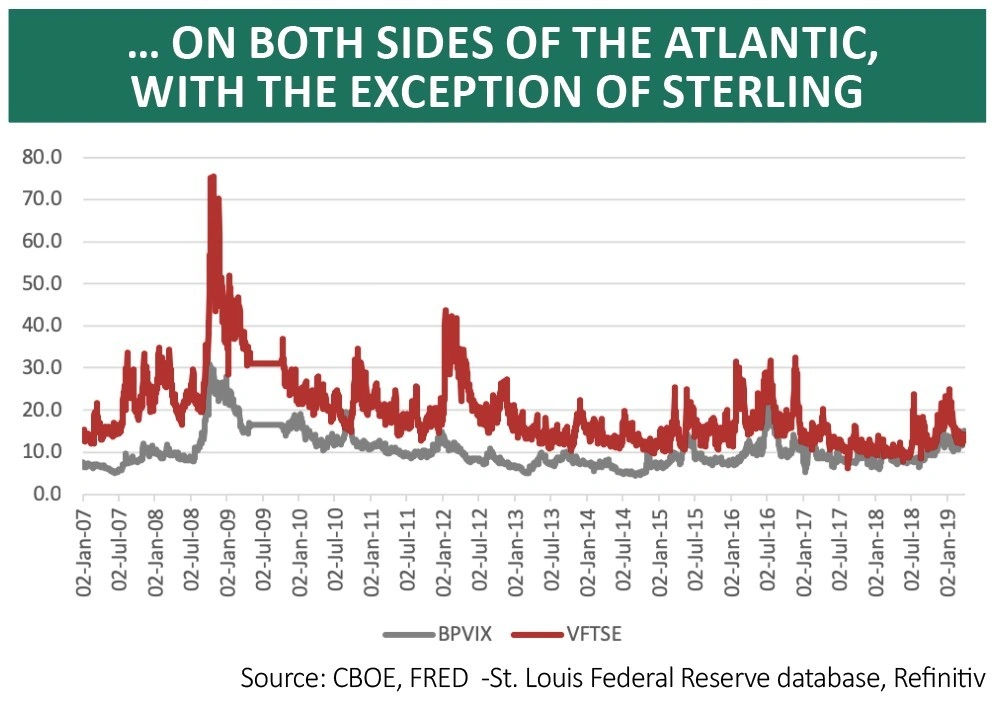
This can be checked by looking at the Chicago Board of Options Exchange’s volatility indices, which measure expected market volatility in the next 30 days across a range of asset classes.
In the US, the VIX index, which tracks expected stock market volatility, stands at 13.7 against a lifetime average of 19.2. The MOVE, which gauges expected volatility for the US 10-year Treasury bond, reads 4.4 against a long-term average of 6.3.

In the UK, the VFTSE, the British version of the VIX ‘fear’ index, reads 12.8 against its long-term average of 19.2. The only area where traders seem to expect any wild activity is sterling where the current level of 14.7 easily exceeds the BPVIX index’s lifetime average of 10.1.
MONETARY MEDICINE
Given the prevailing lack of clarity on the vexed issue of Brexit at the time of writing the state-of-alert with regard to sterling is easy to understand.
Yet it may also be possible to square the circle between rising stock prices and rising bond prices, too.
Bonds may be rallying because economic weakness could mean interest rate cuts and more quantitative easing (QE) – the Federal Reserve and European Central Bank quickly parked any plans to tighten policy this year and they have been swiftly followed by central banks in Australia, New Zealand, the UK, Indonesia and Taiwan to name but five.
QE would mean more price-insensitive buyers of bonds so canny fixed-income traders are getting in now. And if they drive bond yields lower that takes us back to the TINA argument for equities (There Is No Alternative), especially from a yield perspective. That may explain why stock markets are motoring.
This all looks very bullish and could set the scene for a melt-up, with the compliments of the world’s central banks.
But experienced investors may also remember how long periods of below-average volatility in 1993, 1996, 2005-06 and (to a much lesser degree) 2017 and 2018 preceded sudden market dislocations of varying length and depth.
Highly respected investor Warren Buffett says ‘speculation is most dangerous when it looks easiest’ so investors might like to use this year’s first-quarter bonanza to reassess any tactical portfolio allocations, or at least stress test them, to ensure that risk is properly calibrated according to well-defined long-term goals and target returns.

Important information:
These articles are provided by Shares magazine which is published by AJ Bell Media, a part of AJ Bell. Shares is not written by AJ Bell.
Shares is provided for your general information and use and is not a personal recommendation to invest. It is not intended to be relied upon by you in making or not making any investment decisions. The investments referred to in these articles will not be suitable for all investors. If in doubt please seek appropriate independent financial advice.
Investors acting on the information in these articles do so at their own risk and AJ Bell Media and its staff do not accept liability for losses suffered by investors as a result of their investment decisions.
Issue contents
Big News
- The week's big news: Saga, Debenhams and more
- Funding Circle income fund to close after performance flop
- Brexit blamed for worst business investment figures since 2008
- Superdry shares still weak despite Dunkerton win
- Jupiter European funds downgraded as star manager set to step down
- Lack of IPOs is bad news for brokers


