Archived article
Please note that tax, investment, pension and ISA rules can change and the information and any views contained in this article may now be inaccurate.
 magazine
Getting clever with ETFs: Part 2 of our fund series

Product launches in the exchange-traded fund (ETF) space over the past couple of years have been dominated by smart beta ETFs. These types of ETFs aim to be more sophisticated than straight index tracking vehicles.
Smart beta ETFs fall somewhere between passive and active funds. Instead of following a traditional market capitalisation weighted index, they follow an index constructed according to a specific ‘factor’, such as size, value or volatility. Some indices will be built using a combination of these factors.
‘Smart beta is basically any strategy that deviates from a standard market cap weighted index, but does so by using a rules-based methodology rather than being discretionary,’ explains Chris Mellor, executive director at ETF provider Source.

The hope is that by following a factor-based strategy – some of which have been around for almost 100 years – smart beta ETFs will outperform traditional benchmarks.
‘Smart beta ETFs take things an active manager would do, codify them and run them in a more efficient, direct way by cutting out human intervention,’ says Mellor.
Portfolio use
Some investors use smart beta ETFs as a core part of their portfolio – perhaps by replacing an ETF that tracks the MSCI World index with a product such as Source Goldman Sachs Equity Factor Index World UCITS ETF (EFIW).
This specific ETF offers broad, global exposure but aims to outperform traditional benchmarks by emphasising five factors: low beta, size, value, momentum and quality.
‘It’s a long way from a standard market cap weighted benchmark. The only risk an investor is taking is stock selection,’ claims Mellor.
It is also worth bearing in mind that any product linked to the stock market comes with the risk that values might fall.
Other investors use smart beta ETFs to play a particular theme or idea.
There are some exporter-focused products which contain stocks based on the percentage of revenue they get from outside their home market.
An example is Source Stoxx Japan Exporters UCITS ETF (JPEX), which is designed as a play on quantitative easing devaluing the yen currency and boosting foreign revenues for exporters.
It is also possible to try to time smart beta ETFs. If you think value-based strategies are going to do well, you could buy a value-oriented ETF such as iShares Edge MSCI World Value Factor UCITS ETF (IWVL).
Fees vs performance
Smart beta ETFs tend to be a bit more expensive than their traditional counterparts, although the actual fee will vary according to the product’s complexity and the competitiveness of the market in which it operates.
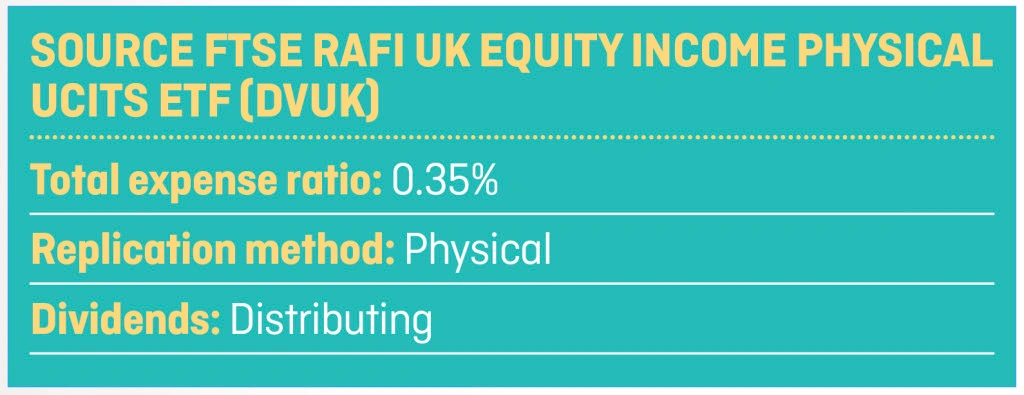
Source FTSE RAFI UK Equity Income Physical UCITS ETF (DVUK) tracks stocks that have the potential to offer a high, sustainable income. It has an ongoing charge of 0.35% whereas plain vanilla FTSE 100 ETFs can have ongoing charges of less than 0.1%. As a reminder, a standard FTSE 100 ETF is tracking a group of stocks simply because they are the 100 biggest companies on the UK market – there is no thought given to income sustainability or other factors.
The Source Goldman Sachs Equity Factor Index World UCITS ETF has an ongoing charge of 0.65% compared with 0.19% for the Source MSCI World UCITS ETF (MXWO) which is a more vanilla product.
UNDERPERFORMANCE RISK
Another downside of smart beta ETFs is the risk they will underperform their benchmarks by more than the ongoing charge. This is because they need to carry out regular rebalancing.
With a market cap weighted ETF there is very little need for rebalancing because the stock weightings naturally change. Smart beta ETFs need to rebalance frequently.
An equal weighted ETF, which weights stocks equally instead of according to market cap, is rebalanced quarterly.
Mellor claims that because smart beta ETFs aim to perform better than market cap products, this covers the additional cost.
‘When you look at most factor strategies we’re involved in, they perform better than market cap weighted strategies by more than enough to offset the additional fees and costs,’ he says.
UNDERSTANDING MARKET BEHAVIOUR
Darius McDermott, managing director at Chelsea Financial Services, says there can be other reasons for underperformance.
‘Markets aren’t always rational and, no matter how much you back-test a scenario, the million to one chance event change can actually happen. We saw this in the great financial crisis, when many a “black-box” failed.
‘Herd mentality can also be a risk – as we saw with gold ETFs not too long ago. If something is flavour of the month you need to see how an ETF handles flows – both in and out – as it can impact performance and liquidity,’ explains McDermott.
ETF INVESTMENT STRATEGIES BASED ON QUALITY, VALUE and SIZE
Three common factors that smart beta ETFs use are quality, value and size. They each have their own set of rules and each one is likely to perform differently during various market cycles.
1. Quality
Quality ETFs are difficult to define because the measure of quality used by different providers varies widely. The strategies look at various profitability metrics, earnings stability and the financial health of the company.
Mellor says that instead of seeking outperformance in the good times, quality ETFs look to outperform in the bad times. They exclude stocks which could be most at risk during a market downturn.
Quality indices are usually designed to provide a high and sustainable yield. This could make them appealing to investors who want a degree of certainty from their investment.
iShares has two quality factor ETFs which contain stocks exhibiting a high return on equity, low levels of debt and low earnings variability. They are iShares Edge MSCI World Quality Factor UCITS ETF (IWFQ) and iShares Edge MSCI European Quality Factor UCITS ETF (IEFQ).
The global version invests in companies like Apple (AAPL:NDQ), Microsoft (MSFT:NDQ), Exxon Mobil (XOM:NYSE), Johnson & Johnson (JNJ:NYSE) and Berkshire Hathaway (BRK.A:NYSE).
The European version includes Total (FP:EPA), Roche (ROG:VTX), Novo Nordisk (NOVO-B:CPH), Allianz (ALV:ETR) and British American Tobacco (BATS).
Some quality strategies can result in controversial decisions. For example, Source JPX-Nikkei 400 UCITS ETF (N400) doesn’t contain Sony (6758:TYO), despite it being one of Japan’s most well-known companies.
The benchmark index for that ETF filters stocks according to their return on equity, market cap, whether they publish accounts in English and whether they have independent directors on their board.
The aim is to focus on companies most likely to benefit from the country’s economic policy which is currently about boosting Japan’s growth through improved productivity.
‘It includes stocks which are likely to be more productive and offer better shareholder value and support – which hasn’t always been the case in Japan,’ says Mellor.
ANOTHER REASON TO LIKE QUALITY ETFS
McDermott at Chelsea Financial Services says an investor might like to include a quality ETF in their portfolio to give it a style bias.
‘In recent years quality stocks have done well as they are considered safer and more reliable and usually have a better dividend yield. As we have seen, though, they can become expensive when everyone is chasing the same idea.
‘These types of ETFs suffered in 2013 during the first taper tantrum, for example. These types of stock sold off as interest rate rises became more anticipated by the market. The bond proxies also suffered post Trump’s election as, again, the likelihood of interest rate rises increased,’ he says.
Taper tantrum is a term used to describe the 2013 surge in US government bond yields as the central bank gradually reduced the amount of money it was feeding into the economy.
The term ‘bond proxies’ is a way of describing companies on the stock market such as consumer staples and utilities that have safe, predictable returns, but have higher yields than much of the bond market. Bond yields tend to rise when interest rates rise, so bond proxies become less desirable in comparison.
2. Value
Value is one of the oldest investment strategies, dating back to the 1920s. The premise is that markets can be irrational and investors can get overly excited or depressed, so buying stocks which trade at a discount should reap rewards over the long-run.
‘In the short-term stocks can keep getting cheaper, so (value investing) is very much a long-term strategy,’ says Mellor.
The strategy tends to perform well in times of growth and recovery. In the past six months, the MSCI World Value Index (USD) has outperformed, finishing 2016 with a gain of 13.2% versus 8.2% for the traditional MSCI World Index.
The MSCI World Value Index filters stocks according to price to book value, price to 12-month forward earnings and dividend yield. Constituents include General Electric (GE:NYSE), Wells Fargo (WFC:NYSE), AT&T (T:NYSE) and Bank of America (BAC:NYSE). You can get exposure via iShares Edge MSCI World Value Factor UCITS ETF (IWVL).
Mellor says value and quality strategies can work well alongside each other. ‘With a value strategy the biggest risk is that the market is right and a stock is about to go bust. Avoiding this value trap is key. Using measures of quality allow you to filter out value traps.’
3. Size
Traditional benchmark indices weight stocks according to their market cap – in other words their size as dictated by the value of each company in the market.
If you buy a FTSE 100 ETF, instead of having a 1% allocation to every company in the index, your exposure will be skewed towards the biggest companies. HSBC (HSBA), for example, accounts for 6.45% of the index whereas EasyJet (EZJ) accounts for just 0.14% (as of 30 September 2016).
This means your portfolio won’t be as diversified as you might think and will be more affected by any problems among the larger companies on the market. For example, anyone invested in a FTSE 100 tracker fund would have been heavily exposed to the impact of a major oil spill at BP (BP.), one of the indices’ largest companies, in 2010.
‘The problem with market cap weighted products is that as bubbles form in the market, it will increase the weighting of the most overvalued stocks,’ says Mellor.
‘When the bubble bursts, the product is more likely to underperform. Just look at the early 2000s when technology made up a quarter of the weight of the S&P 500 Index,’ says Mellor. The tech bubble burst at the start of that decade with significant decline in the value of shares across most of the sector; some companies even going bust.
A way to get around the risk over being exposed to bubbles is to opt for an equal weight ETF, such as db X-trackers FTSE 100 Equal Weight UCITS ETF (XFEW). That product gives each company in the FTSE 100 a fixed weight of 1%.
The equal weight strategy will most likely alter your exposure to market sectors. The db X-trackers product has a significantly lower weighting to the oil and gas sector than the FTSE 100, but a higher exposure to the industrials sector.
Another example of an equal weight ETF is Ossiam Stoxx 600 Equal Weight ETF (L6EW), which gives equal weight to the 600 companies in the Stoxx 600 Index. This means you get a greater exposure to lots of small cap stocks.
‘Small cap stocks tend to outperform over the long run because large stocks which everyone knows about offer fewer opportunities for surprise. When the market is in bubble territory, the largest stocks become very fashionable and get overvalued, so they can underperform when reality resumes,’ says Mellor.
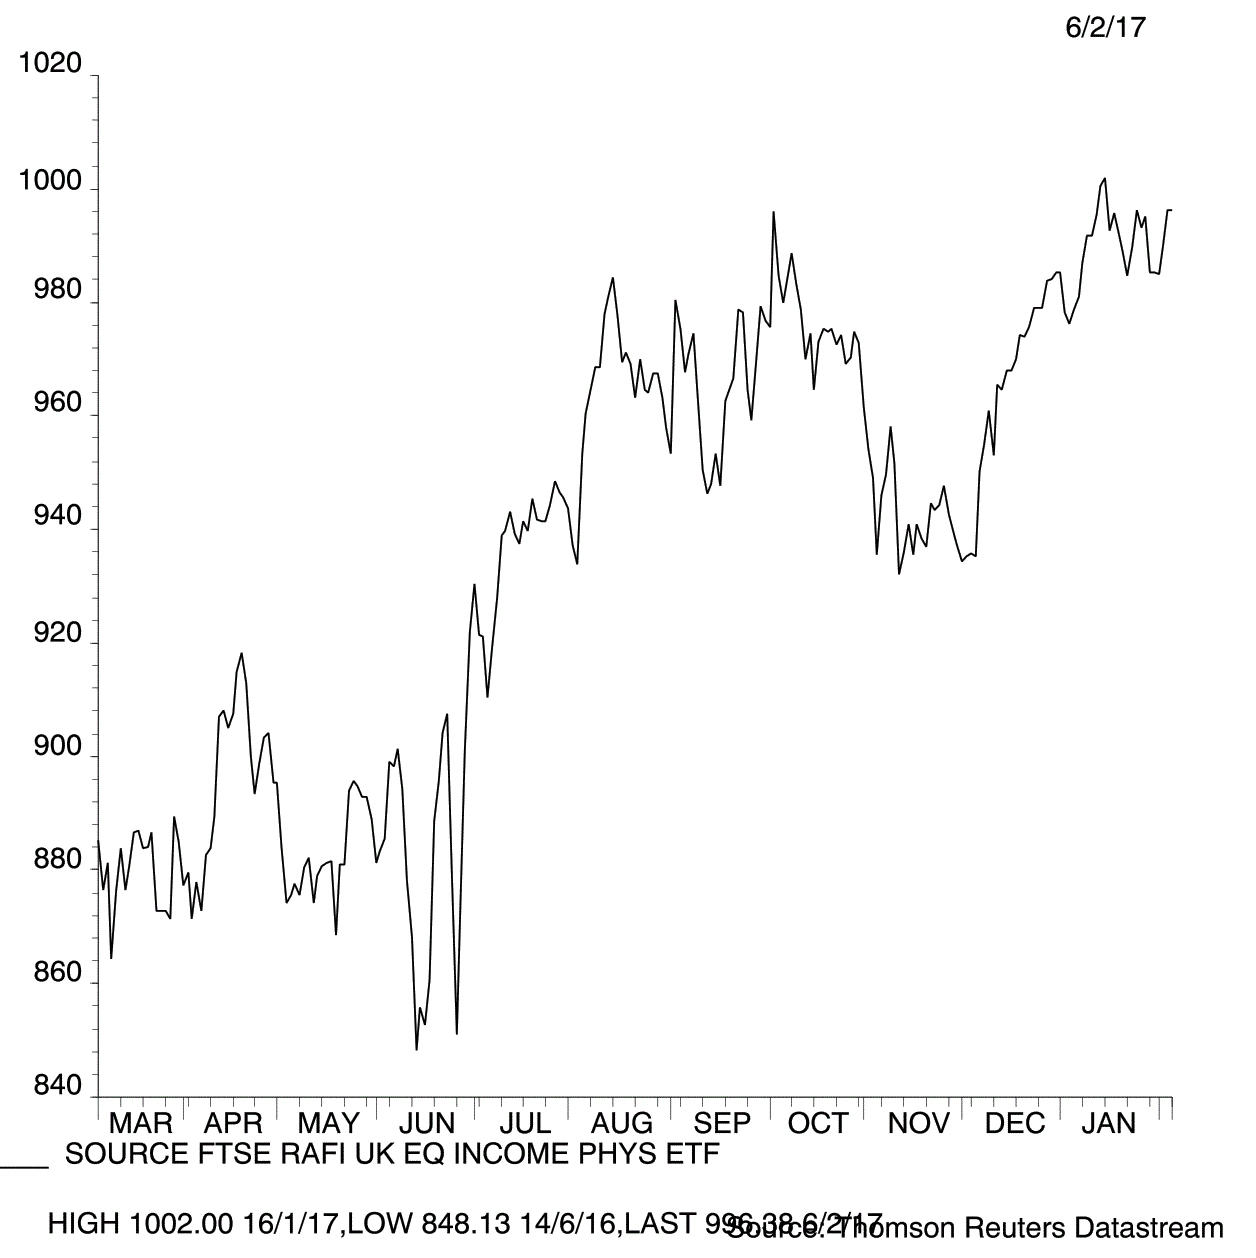
Source FTSE RAFI UK Equity Income Physical UCITS ETF (DVUK)
The Source FTSE RAFI UK Equity Income Physical UCITS ETF is part of a family of three smart beta ETFs, which also includes a US version and a European version. The UK version comprises 68 UK stocks which aim to offer a high, sustainable income.
Stocks are screened for their financial health using metrics such as profitability, debt servicing ability and accounting quality.
They are selected on the basis of their dividend yield relative to their sector. The stocks are then weighted by a combination of dividend yield and economic size.
The product is a mash-up of several smart beta ‘factors’. It combines value with quality and has a small cap bias.
‘Stocks are selected based on their dividend yield. This is a value metric because if a company has a high yield it could be a signal that it is undervalued,’ says Source’s Chris Mellor.
‘There is a risk that a high dividend yield is indicating the company is in financial distress and the dividends may not be continued. Stocks are therefore filtered according to quality measures to weed out the companies who are most likely to cut dividends.
‘The index looks at revenue, book value, dividends and cash flow as fundamental measures of how large a weighting the stock should have. This avoids over-inflated stocks,’ he adds.
Will Dickson, investment manager at financial services group Prydis, claims ETFs sometimes combine factors together because different factors tend to perform well at different times in the market cycle.
‘Quality could perform well when other factors don’t, and vice versa, so combining them could create a slightly smoother ride,’ he says.
Dickson suggests ETFs that combine factors could be viewed as an ‘invest and leave’ strategy, whereas ones based on a single factor probably require investors to make the right call at the right time.
The Source FTSE RAFI UK Equity Income Physical UCITS ETF was launched in March 2016 and therefore has a short performance history. Over the past six months, its total return was 6.6 % (as of 30 January 2017).
Important information:
These articles are provided by Shares magazine which is published by AJ Bell Media, a part of AJ Bell. Shares is not written by AJ Bell.
Shares is provided for your general information and use and is not a personal recommendation to invest. It is not intended to be relied upon by you in making or not making any investment decisions. The investments referred to in these articles will not be suitable for all investors. If in doubt please seek appropriate independent financial advice.
Investors acting on the information in these articles do so at their own risk and AJ Bell Media and its staff do not accept liability for losses suffered by investors as a result of their investment decisions.


