Archived article
Please note that tax, investment, pension and ISA rules can change and the information and any views contained in this article may now be inaccurate.
 magazine
More ways to prosper with ETFs: Part 3 of our fund series

Investors are pouring in money in the hope that smart beta and factor-based ETFs will outperform ‘vanilla’ ETFs which just track broad stock market indices. They also attracted to smart beta and factor-based ETFs because they can add some extra diversification to an investment portfolio.
In last week’s feature we explained the ins and outs of three commonly-used factors: quality, size and value. In the final part of our ETF series, we now look at momentum, low beta/minimum volatility and multi-factor products.

As with all smart beta ETFs, these products follow an index that uses a weighting scheme other than market capitalisation. They are still ETFs because they passively track the index, instead of being discretionary.
1. Momentum
A momentum strategy buys the stocks that keep going up in value in the expectation they will continue to move upwards. Think about a particular company whose share price goes up, up and up a bit more. Many investors will spot this and want to hitch a ride upwards by also buying the stock.
It’s a strange concept to get your head around if you’re used to the theory that you should invest in something before everyone else realises how good it is.
‘The theory behind momentum is that stocks are going up for a reason, whether that’s earnings or mergers and acquisitions activity,’ says Chris Mellor, executive director at ETF provider Source.
‘You use price momentum as a short hand for getting exposure to the underlying trend. Evidence suggests price rises usually carry on for longer than people expect.’
A common way to screen stocks for a momentum index is to use a ’12 month minus one month’ strategy. According to the theory, there is usually a positive correlation between the past year and the future but this isn’t necessarily the case for the final month. The strategy screens out companies with a large jump in the share price over the past month, which could reverse shortly thereafter.
Mellor says momentum is one of the more stable outperformers in the factor space, but when markets turn it is usually one of the worst performing strategies. ‘It comes with some pretty painful pullback periods,’ he says.
Momentum is negatively correlated with value, which is about buying undervalued stocks. ‘Ultimately it’s about whether it is better to be right with the crowd or right but against the crowd,’ says Mellor.
‘With value, you can be right over the long-term but you need to be prepared to be wrong in the short-term. Momentum is the opposite – you might be right in the near term but it could hurt you over the long run.
‘In theory, what you lose in the bad times should be more than offset by the good times,’ he adds.
Momentum trades can be exciting but you must be aware that an upward trend can quickly reverse and share prices can fall fast
ARE THERE PARTICULAR BENEFITS TO A MOMENTUM STRATEGY?
Momentum can be a useful way of capturing trends and themes in the market, such as demand for technology and biotech. For example, Apple (AAPL:NDQ) would have featured in many momentum strategies over the past decade.
You can get exposure to the strategy via products such as iShares Edge MSCI World Momentum Factor UCITS ETF (IWMO). It invests in a sub-set of global MSCI stocks which have been experiencing an upward price trend.
Stocks currently being tracked by this ETF include Amazon (AMZN:NDQ), British American Tobacco (BATS), BP (BP.), Facebook (FB:NDQ), HSBC (HSBA), Johnson & Johnson (JNJ:NYSE) and Microsoft (MSFT:NDQ).
The MSCI World Momentum Index underperformed the broader index in 2016, returning 4.75% versus 8.15% for the MSCI World. On a 10 year basis it has outperformed, with annualised return of 6.07% versus 4.54% for the MSCI World (based on data up to 31 January 2017).
2. Low beta/minimum volatility
Investors might want to consider ETFs with a low beta or minimum volatility strategy if they’re seeking a lower-risk component for their investment portfolio. These products may be particularly interesting to anyone who is worried about the stock market falling in value in the near term.
‘Low beta/minimum volatility tends to outperform during market pullbacks. It does less well when there are very strong (upwards) moves in the market, but it saves you from big declines,’ says Mellor.
Low beta and minimum volatility strategies achieve a similar outcome to one another but their approaches are different.
A low beta strategy selects the stocks based on their exposure or correlation to the market. It selects stocks with the lowest beta. In simpler terms that means companies with lower volatility than the market or whose price movements are not highly correlated with the market.
A minimum volatility ETF looks at stocks’ historic volatility and selects the ones with the lowest volatility. These stocks also tend to be low beta.
An example is iShares Edge MSCI Europe Minimum Volatility UCITS ETF (MVEU). It tracks an index which is constructed of European companies and seeks to minimise the stock market’s peaks and troughs.
Companies in the index include Danske Bank (DANSKE:CPH), Nestle (NESN:VTX), L’Oreal (OR:EPA) and Randgold Resources (RRS).
The MSCI Europe Minimum Volatility (EUR) Index has a 10-year annualised return of 4.5% compared with 3.2% for MSCI Europe.
An alternative product is Source RBIS Equal Risk Equity Europe UCITS ETF (REQR). It tracks an index which eliminates the 50% riskiest stocks, as determined by their volatility and correlation, and then weights the remaining stocks so that each one contributes an equal amount of risk.
‘You get a similar performance as you would with a minimum volatility ETF but it’s a simpler construction. It puts risk control at the heart of the process, rather than at the end,’ says Mellor.
This ETF currently provides exposure to such companies as Syngenta (SYNN:VTX), Kerry (KYGA), Lindt & Spruengli (LISN:SWX) and Adidas (ADS:ETR).
Low beta/minimum volatility ETFs may suit a nervous investor worried about a pullback in the stock market
3. Multi-factor
If you’re not convinced about the merits of single factor ETFs you could opt for a multi-factor product which combines several factors into one vehicle.
Multi-factor products aim to get around the fact that many single factors will have prolonged periods of underperformance and outperformance. Value, for example, underperformed for most of the past two years before having a resurgence in the middle of 2016.
‘Multi-factor strategies underperform less – you get a higher hit rate – and they have lower volatility,’ says Mellor.
It is important to stress this outcome isn’t guaranteed. The past six months have been a tough time for most factor products (aside from value), which has resulted in multi-factor also struggling.
Yet over the long-term, the MSCI World Diversified Multiple-Factor Index has outperformed the MSCI World by 2%.
This index is tracked by iShares Edge MSCI World Multifactor UCITS ETF (IFSW). It provides exposure to four factors: value, momentum, quality and low size. Buying that ETF would provide exposure to the likes of Accenture (ACN:NYSE), Cigna (CI:NYSE), General Motors (GM:NYSE) and Hewlett Packard Enterprise (HPE:NYSE).
Income is not a 'factor'
Although you might come across some dividend-themed ETFs, income is not actually a factor.
Most income strategies have a value bias because they select stocks based on the highest yield, which in itself is a value metric.
If a stock has a high yield it could indicate it is undervalued, although there is a risk it is under financial distress and dividends could be scrapped. To minimise this, some dividend-focused indices also include a quality check.
A popular ETF is the SPDR S&P UK Dividend Aristocrats UCITS ETF (UKDV), which chooses stocks with a high yield and whose dividends have increased or held steady for at least 10 years.
In doing so, it avoid companies which don’t pay dividends every year or have had to make cuts to their dividends over the past decade.
To qualify for the index, companies must also have to be profitable and not pay dividends from reserves or borrowings.
Companies in the index include G4S (GFS), GlaxoSmithKline (GSK), SSE (SSE), BAE Systems (BA), AstraZeneca (AZN) and Burberry (BRBY).
Source has a suite of FTSE RAFI equity income ETFs which focus on dividends. The products also look at company quality by analysing return on equity, interest coverage ratios and accounting quality.
Stocks are weighted by a combination of dividend yield and economic size. There are UK, European and US versions of this ETF.
The US version, Source FTSE RAFI US Equity Income Physical UCITS ETF (DVUS), provides exposure to well-known companies including Wells Fargo (WFC:NYSE), Chevron (CVX:NYSE) and Wal-Mart Stores (WMT:NYSE).
The fund has a short performance history as it is relatively new; over the last six months it produced a total return of 9.7% (as of 6 February 2017).
Smart beta risks
There are three potential risks when it comes to factor investing, according to Russ Mould, investment director at AJ Bell Youinvest:
1. Although smart beta or factor ETFs seem to be a passive investment, the investor is making an active choice based on the factors involved.
It is unlikely that one factor will always work all of the time, as evidenced by the recent fall from grace of low-volatility and quality growth and the resurgence of the long-neglected value option.
2. The ETF could suffer from tracking error and underperform its targeted benchmark index.
3. Smart beta or factor ETFs can come with higher total expense ratios than those which follow mainstream indices like the FTSE 100 or the S&P 500, so it is possible some of the performance generated could be lost to additional fees.
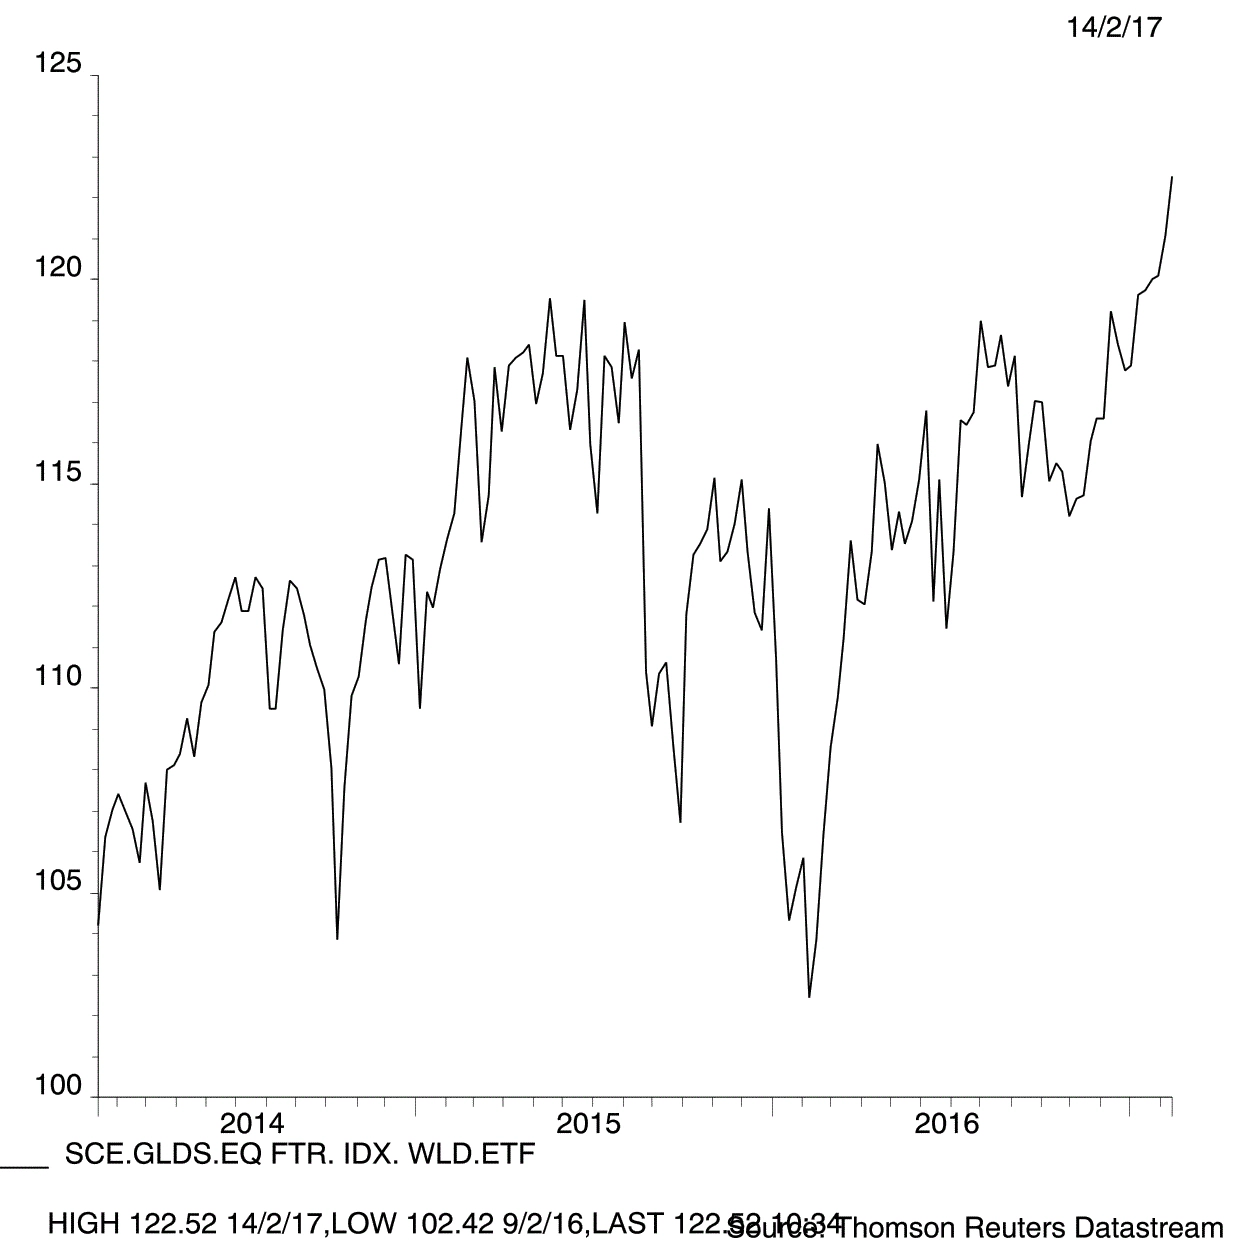
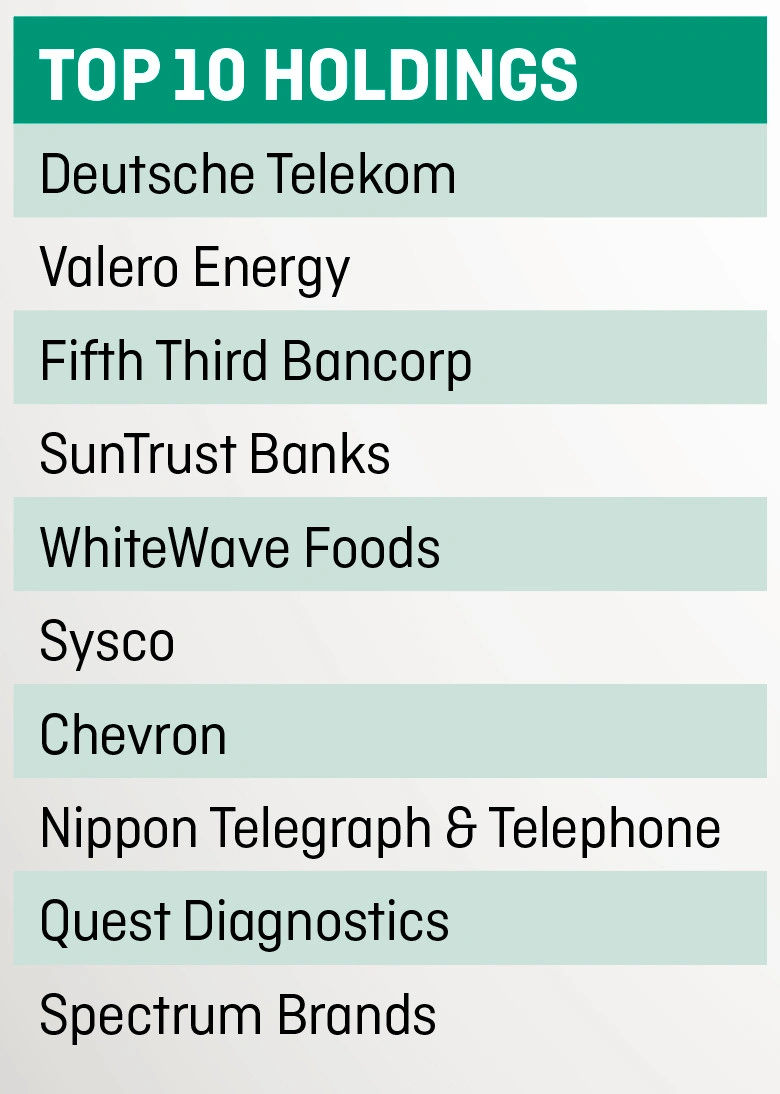
THIS WEEK'S PRODUCT PROFILE:
Source Goldman Sachs Equity Factor Index World UCITS ETF offers broad, global equity exposure. It aims to outperform traditional benchmarks by emphasising five equity market factors: low beta, size, value, momentum and quality.
The portfolio is drawn from a universe of securities from 22 developed markets around the world.
A combined factor score is calculated for each stock, with the five different factors weighted such that they contribute an equal amount of risk.
The stocks are then combined and weighted to create a portfolio that maximises the overall factor score. The maximum weighting per constituent is 0.5%.
By combining stocks in this way the fund avoids selecting stocks that may score well on one factor but badly on another; for example, if a stock scored +2 for value and -2 for momentum, they would cancel each other out.
The ETF aims to provide consistent outperformance by providing diversified exposure to the five factors while strictly controlling exposure to unrewarded risks.

Source’s Chris Mellor says the product aims to give a general bias to stocks that will outperform over the long term. He likens it to a football team which might have some players with specific goal-scoring skills, others with tackling skills and others with goal-saving skills.
‘A really good team would be comprised of players who are good at all these things. The midfield might not be good enough on a single factor but it is good enough on different factors for a multi-factor team,’ he says.
Mellor admits the ETF is more complex than a market cap or equal weighted ETF, but he says it still uses the same idea of picking stocks and ensuring the fund tracks the performance of an index.
The ETF was launched in January 2014 so it has very short performance history. In 2016, it produced a total return of 4.6%, underperforming the traditional Source MSCI World UCITS ETF (MXWO), which returned 7.5%. Over the last three years the fund has returned 19.3% on a total return basis, 1.1% more than the MSCI World ETF.
The ETF uses a ‘swap-enhanced’ structure. It invests in the physical equities but there is a swap overlay to try to minimise tracking error. It uses several counterparties to reduce the impact of one defaulting.

Important information:
These articles are provided by Shares magazine which is published by AJ Bell Media, a part of AJ Bell. Shares is not written by AJ Bell.
Shares is provided for your general information and use and is not a personal recommendation to invest. It is not intended to be relied upon by you in making or not making any investment decisions. The investments referred to in these articles will not be suitable for all investors. If in doubt please seek appropriate independent financial advice.
Investors acting on the information in these articles do so at their own risk and AJ Bell Media and its staff do not accept liability for losses suffered by investors as a result of their investment decisions.