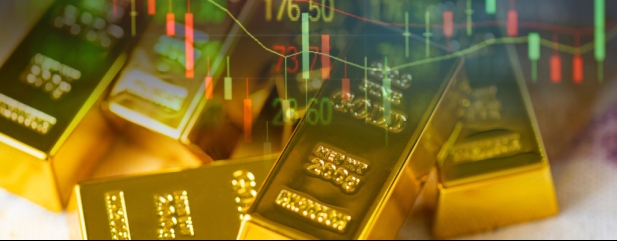
Gold enthusiasts are getting excited about the ‘golden cross’ which has just appeared on their technical charts. This happens when a short-term moving average of prices, say over the last 50 days, rises above a long-term moving average, say 200 days, and is often used by technical traders as a buying signal. Hitting one of these graphical epiphanies has got the gold trading community chattering excitedly.
If you’re thinking to yourself that the intersection of two lines on a chart isn’t an entirely compelling reason to buy into an asset in the real world, then you have a very fair point. However, there are some more fundamental factors which are also giving gold investors cause for optimism.
WHY A WEAKER DOLLAR IS GOOD FOR GOLD
One is the effect of a weakening dollar. Gold and the dollar are inversely correlated with each other, not least because the precious metal is priced and traded in the US currency. Since the beginning of 2021, the dollar has been on the rampage, as markets woke up to the prospect of interest rate rises in the world’s most influential currency.
But the dollar has fallen against a trade-weighted basket of currencies by around 10% since its peak in September, and that partly helps to explain why gold has risen by around 15% in dollar terms over the same period.
UK investors need to be a bit wary here, because if the dollar is falling against a broad basket of global currencies, that’s likely to include the pound. Since the end of September, the price of gold has risen by just 3% in sterling terms, so UK investors have not enjoyed the full force of the recent rally because of currency movements.
It’s also interesting to note that figures from the World Gold Council show that the 12-month return for gold after a dollar peak has been 16% on average. There has been a wide range of outcomes, from the gold price rising more than 30% in the 12 months from the dollar peak in 2005, to falling by almost 15% in 1969. Nonetheless, the 15% rally in the price of gold since September is pretty much bang on the average 12-month return after a dollar peak, which suggests the upside may be limited from here.
GOLD AS A SAFE HAVEN?
Gold is also often seen as a safe haven, and with a global economic slowdown on the cards, some might see this as an opportunity for gold to shine. That may prove to be the case, though you’d have to be living down a pretty deep mine shaft to have avoided hearing about recessionary conditions, so you’d expect this to be already largely factored into the gold price.
This is also a bit of an unusual slowdown, because central banks are hiking interest rates despite weakening economic growth. This is negative for gold, because it pays no interest, and so looks less attractive compared to other safe havens like bonds and cash when yields rise.
If the global slowdown proves worse than expected in 2023, and central banks have to slow or even reverse interest rate hikes, that could be positive for gold. So gold can act as a bit of insurance against calamity, which is probably no bad thing in a world of heightened geopolitical tensions and continuing Covid infections.
But while gold traders often think in just days, weeks or months, everyday investors usually want an asset they can hold for years, and the long-term case for gold is more nuanced. We can have a fair degree of confidence that an investment in the stock market will provide a decent return if held for 10 years or more.
Shares in companies produce cash flows generated from economic activity, which rises over time. Gold produces no cash flows and has few industrial uses, with demand mostly coming from jewellery manufacture and investment,so it’s difficult to pin an intrinsic value on the precious metal.
The long-term direction of gold is pretty difficult to gauge because, with no cash flows to speak of, sentiment will play a large part in pricing.
GOLD PRICES HAVE BEEN VOLATILE
From its peak in 1980, the gold price fell by 33% over the next 20 years, and it took 27 years for gold to reach its former high, as the chart below shows. That’s a long period in the wilderness. The stock market has also experienced some lengthy spells of weak performance, if you similarly look at the extremes.
From the height of the dotcom bubble in 1999 to the depths of the pandemic in 2020, the FTSE 100 fell by almost 30%. But Refinitiv data suggests that, over this period, an investor would have still experienced a 50% return on their money with dividends rolled up. Gold investors didn’t have this compensation.
For a ‘safe’ haven, gold can be volatile even over a relatively short period. Between 1980 and 1982, the gold price fell by over 60%, and between 2011 and 2015, it fell by around 45%.
The value of the precious metal lies in its ability to act as a bit of diversification in a portfolio, because it behaves differently to other assets, especially equities. If you’re a conservative investor, you might therefore hold bonds and gold alongside equities, because they will tend to perform well at different times.
‹ Previous2023-01-19Next ›
 magazine