Archived article
Please note that tax, investment, pension and ISA rules can change and the information and any views contained in this article may now be inaccurate.

American politics will be dominated by November’s Presidential election. Since 1948 the final year of a President’s term has witnessed the weakest average returns from the Dow Jones Industrials.
On the economic front, the US Federal Reserve, under the guidance of chair Janet Yellen will remain a dominant influence, as the debate over the degree and pace of any interest rate increases will continue to rage.
History suggests the US market performs worst in the three-to-six month periods leading up to and coming out of the first hike of a new upward cycle and then re-gathers its footing – providing valuations are not stretched and underlying corporate earnings momentum remains healthy.
Lofty valuations and potentially optimistic earnings expectations must also be borne in mind as both could trip up unwary investors, even if a rising dollar could help boost returns in sterling terms, especially if the Fed does screw up its courage and start to tighten monetary policy.
Politics
On Tuesday 8 November 2016 Americans will get to vote in the fifty-ninth Presidential election and choose their forty-fifth President and forty-eighth Vice President.
Hillary Clinton and Vermont Senator Bernie Sanders look to be the key front-runners on the Democrat side, although rumours suggest Secretary of State John Kerry may look to make a late run, following his failed bid to unseat George W. Bush in 2004.
On the Republican side real estate magnate Donald Trump still leads the polls, to the surprise of many, as he revels in his outsider status.
Other prominent candidates include Senators Ted Cruz and Marco Rubio, New Jersey Governor Chris Christie and another political outsider, the retired neurosurgeon Ben Carson.

The picture will only begin to clear when the state primaries and caucuses commence on 1 February 2016 in Iowa, with New Hampshire, Nevada and South Carolina following in the lead-up to Super Tuesday on 1 March, when 13 states have their say, including Texas.
Both races could run all the way through to June, with the California and New Jersey primaries.
The winners will be officially announced in July at the respective party conventions in Cleveland (Republicans) and Philadelphia (Democrats).
Political picks
Stocks are long-term assets whose worth is driven by long-term cash flows but policies can shape the fortunes of business, especially when it comes to tax and regulation.
Hillary Clinton’s threats to clamp down on drug prices and this summer’s tumble in biotech stocks is a prime example.
This may explain why the fourth year of a Presidential term has, on average, provided the weakest returns from US stocks since the Second World War.
The fourth year of a Presidential term is on average the weakest in terms of stocks market returns
| Election | President | Party | Year 1 | Year 2 | Year 3 | Year 4 |
| 1948 | Harry S. Truman | Democrat | 12.9% | 17.5% | 14.5% | 8.4% |
| 1952 | Dwight D. Eisenhower | Republican | -3.8% | 44.0% | 20.8% | 2.3% |
| 1956 | Dwight D. Eisenhower | Republican | -12.8% | 34.0% | 16.4% | -9.3% |
| 1960 | John F. Kennedy | Democrat | 18.7% | -10.8% | 17.0% | 14.6% |
| 1964 | Lyndon B. Johnson | Democrat | 10.9% | -18.9% | 15.2% | 4.3% |
| 1968 | Richard M. Nixon | Republican | -15.2% | 4.8% | 6.1% | 14.6% |
| 1972 | Richard M. Nixon | Republican | -16.6% | -27.6% | 38.3% | 17.9% |
| 1976 | Jimmy Carter | Democrat | -17.3% | -3.1% | 4.2% | 14.9% |
| 1980 | Ronald Reagan | Republican | -9.2% | 19.6% | 20.3% | -3.7% |
| 1984 | Ronald Reagan | Republican | 27.7% | 22.6% | 2.3% | 11.8% |
| 1988 | George H. W. Bush | Republican | 27.0% | -4.3% | 20.3% | 4.2% |
| 1992 | Bill Clinton | Democrat | 13.7% | 2.1% | 33.5% | 26.0% |
| 1996 | Bill Clinton | Democrat | 22.6% | 16.1% | 25.2% | -6.2% |
| 2000 | George W. Bush | Republican | -7.1% | -16.8% | 25.3% | 3.1% |
| 2004 | George W. Bush | Republican | -0.6% | 16.3% | 6.4% | -33.1% |
| 2008 | Barack Obama | Democrat | 17.5% | 11.0% | 5.5% | 7.3% |
| 2012 | Barack Obama | Democrat | 26.5% | 7.5% | -0.7% | |
| Average | 5.6% | 6.7% | 15.9% | 4.8% |
Source: Thomson Reuters Datastream
Economics
Under normal circumstances, US interest rates would be a lot higher by now.
The headline (U-3) unemployment rate stands at 5.0% and even the broader U-6 unemployment rate, which includes those out of work for more than a year and those who have given up looking, is 9.8%.
When the US Federal Reserve began its last rate hike cycle in 2004 the U-3 at 5.5% and the U-6 at 9.5% so it looks like the US central bank should be raising headline borrowing costs at a fair clip in 2016.
US jobless figures suggest the Fed would normally be cutting rates by now
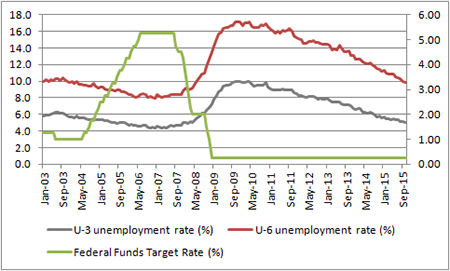
Source: www.bls.gov, Thomson Reuters Datastream
But unemployment and jobs figures are lagging economic indicators as it takes any firm time to feel confident enough to hire and then go through the recruitment process.
Concurrent indicators such as retail sales, durable goods orders and industrial production provide less encouragement after a string of mixed readings.
Growth in retail sales, durable goods orders and industrial production remains spotty

Source: Thomson Reuters Datastream, www.census.gov
Forward view
Moreover, the forward-looking indicators also suggest the US is not yet firing on all cylinders. Besides America’s nationwide purchasing managers’ index (PMI), some of the local branches of the Fed publish their sentiment surveys. The latest results look tepid at best.
Latest industrial sentiment surveys need to affirm recovery from summer's downward trend

Source: Thomson Reuters Datastream
Such readings would perhaps justify a cautious approach and the Fed will also be wary of potential dollar strength.
The greenback has marched higher for over a year, as the markets have anticipated a US rate hike.

If the Fed did increase borrowing costs, the dollar could soar, especially with the Eurozone and Japan still committed to Quantitative Easing (QE) and tacit policies of devaluation, crimping US export growth.
Markets
History suggests the US stock market, as benchmarked by the S&P 500, does least well going into and coming out of the first interest rate increase of a new cycle.
The table below shows how the index has done on average over the seven rate-rise cycles seen since 1971.
The S&P 500 has historically been at its weakest around the time of a first Fed rate hike
| Before first rate hike | Market response: S&P 500 Composite index | After first rate hike | |||||||||
| Cycle | From | To | From | To | 1 year | 6 months | 3 months | 3 months | 6 Months | 1 Year | 2 years |
| Higher | Jul-71 | Apr-74 | 3.50% | 11.00% | 32.0% | 6.7% | -4.1% | -1.5% | 4.1% | 7.6% | 4.8% |
| Higher | Aug-77 | May-81 | 4.75% | 19.00% | -4.2% | -3.2% | -1.0% | -7.8% | -9.3% | 1.6% | 5.1% |
| Higher | Mar-83 | Aug-84 | 8.50% | 11.56% | 36.6% | 27.0% | 8.8% | 9.9% | 7.8% | 4.3% | 23.9% |
| Higher | Dec-86 | May-89 | 5.88% | 9.81% | 23.9% | 33.2% | -0.3% | 14.1% | 16.6% | -11.5% | 7.4% |
| Higher | Feb-94 | Feb-95 | 3.00% | 6.00% | 4.5% | 4.7% | 2.7% | -3.9% | -2.4% | 1.9% | 35.3% |
| Higher | Jun-99 | May-00 | 4.75% | 6.50% | 21.1% | 11.4% | 5.5% | -6.6% | 6.7% | 6.0% | -10.8% |
| Higher | Jun-04 | Jun-06 | 1.00% | 5.25% | 17.1% | 2.8% | 1.2% | -2.3% | 6.4% | 4.4% | 11.3% |
| AVERAGE | 18.7% | 11.8% | 1.8% | 0.3% | 4.3% | 2.0% | 11.0% |
Source: Thomson Reuters Datastream
Ratings game
This makes sense. A rate rise is designed to cool an economy and drain liquidity from markets. But history shows big market falls, such as those seen in 1929, 1987, 2001 and 2007 only tend to occur when we see three things at once:
- Rising interest rates
- Falling corporate earnings (or even an economic recession)
- Lofty stock market valuations, relative to history
Admittedly, the corporate profit picture is cloudy. In the third quarter of 2015, US companies’ profits fell by some 16% year-on-year according to research from Standard & Poor’s.
US corporate profits fell sharply in the first three quarters of 2015

Source: Standard & Poor's research, analyst consensus
The good news is analysts are expecting a big bounce back in 2016, as the above and below charts suggest. The consensus currently assumes a 23% leap in aggregate S&P earnings for 2016 after a forecast 7% drop in 2015 and a meagre 2% advance in 2014.
... but are forecast to rebound quickly in 2016
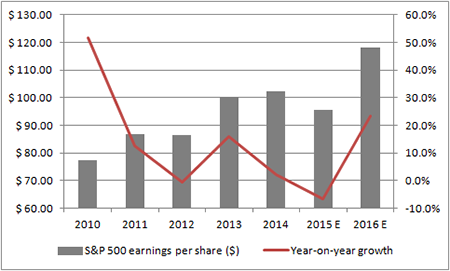
Source: Standard & Poor’s, analyst consensus
Price conundrum
The vexed issue of valuation is just as tricky. America's market cap-to-GDP ratio stands at 133%. This is higher than the peaks seen in both 2000 and 2007, using the Wilshire 5000 as a benchmark.
Market cap-to-GDP ratio also looks elevated, relative to recent history
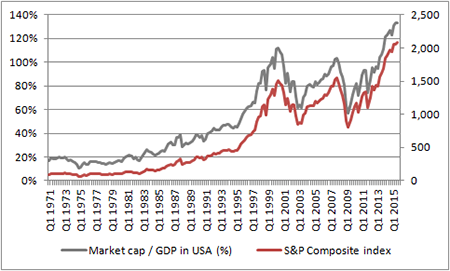
Source: Thomson Reuters Datastream, AJ Bell Research
However, bulls will counter valuation concerns by pointing out US firms have never been more profitable.
Corporate earnings to GDP stand at around 13% against a long-run average of 4.9% so US valuations can be justified – so long as returns remain high relative to history.
How to Access American Markets
According to Morningstar, OIECs offer investors seeking US exposure a huge choice of investment styles and strategies, ranging from large caps to small caps, growth to income and even currency-hedged, for anyone who believes the dollar is overdue a dive lower.
Best performing US Large Cap Blend Equity OEICs over the last five years
| OEIC | ISIN | Fund size | Annualised five- | Twelve-month | Ongoing | Morningstar |
| £ million | year performance | Yield | charge | rating | ||
| Fidelity American Special Situations W (Acc) | GB00B89ST706 | 661.0 | 16.5% | 0.5% | 0.95% | ***** |
| Fidelity America Y (Acc) USD | LU0318939179 | 4,948.6 | 16.2% | n/a | 1.14% | ***** |
| JP Morgan America Equity C (Acc) USD | LU0129459060 | 927.3 | 15.9% | 0.1% | 0.85% | ***** |
| JP Morgan US Select I (Net Acc) | GB0031835225 | 302.9 | 15.2% | 0.9% | 0.60% | ***** |
| HSBC American Index C (Acc) | GB00B80QG615 | 1,601.5 | 14.8% | 1.6% | 0.08% | ***** |
Source: Morningstar, for US Large Cap Blend Equity category. Accumulation units only.
Where more than one class of fund features only the best performer is listed.
Eight investment trusts target North American assets, five large-cap and three small-cap, including one which specifically targets Canada, the Middlefield Canadian Income Trust, although only six have a five-year trading history.
Best performing North American Investment Trusts over the last five years
| Investment Trust | EPIC | Market cap | Annualised five- | Dividend yield | Gearing | Ongoing | Discount | Morningstar |
| £ million | year performance | charge * | to NAV | rating | ||||
| JP Morgan US Smaller Companies | JUSC | 100.4 | 18.1% | n/a | 7% | 1.73% | -3.7% | *** |
| North Atlantic Smaller Companies | NAS | 317.2 | 16.0% | n/a | 0% | 1.14% | -17.8% | ***** |
| JP Morgan American | JAM | 775.0 | 14.8% | 1.2% | 9% | 0.68% | -4.2% | ***** |
| North American Income | NAIT | 260.2 | 10.0% | 3.8% | 10% | 1.04% | -10.4% | *** |
| Jupiter US Smaller Companies | JUS | 143.1 | 9.8% | n/a | 0% | 1.01% | -13.7% | **** |
Source: Morningstar and the AIC, for North America and North American Smaller Companies Categories. * Includes performance fee
Over 80 exchange-traded funds (ETFs) address the USA and the importance of currency is reflected in the predominance of dollar rather than sterling-denominated instruments in the top-performers list.
Best performing US Large-Cap Blend Equity ETFs over the past five years
| ETF | EPIC | Market cap | Annualised five- | Dividend yield | Fund Ongoing | Morningstar | Replication |
| £ million | year performance | Charge | rating | method | |||
| HSBC S&P 500 | HSPD | 1,240.6 | 15.2% | 1.7% | 0.09% | ***** | Physical |
| iShares Core S&P 500 (USD) | CSPX | 8,329.8 | 15.2% | n/a | 0.07% | ***** | Physical |
| iShares S&P 500 (Dist) (USD) | IDUS | 6,715.0 | 14.9% | 1.4% | 0.40% | ***** | Physical |
| HSBC MSCI USA (GBP) | CSUS | 340.1 | 13.2% | n/a | 0.33% | ***** | Physical |
| iShares Dow Jones Industrial Average (USD) | CIND | 141.3 | 13.2% | n/a | 0.33% | ***** | Physical |
Source: Morningstar, for US Large-Cap Blend Equity category. Physical ETFs only. Where more than one class of fund features only the best performer is listed.
AJ Bell’s top tracker for the USA
AJ Bell’s free investment guidance service is based on our list of sixteen Top Trackers. One of these directly covers America and one more gives a prominent role to US stocks.
The iShares Core S&P 500 tracker has the EPIC code of CSP1 and a SEDOL of B521C87.
The tracker is designed to deliver the total performance of America’s S&P 500 index as closely as possible, net of expenses and transaction costs.
The index contains 500 of America’s largest corporations across ten industries, including technology, healthcare and financial services as well as consumer and industrial stocks. The largest individual companies within the index include Apple, Microsoft, oil giant ExxonMobil and personal care expert Johnson & Johnson.
This tracker does not feature in the Cautious or Balanced portfolios but represents 15% of the Adventurous portfolio.
The iShares Core MSCI World tracker has the EPIC code of SWDA and a SEDOL of B4L60Z9.
The index contains over 1,600 large and mid-cap companies from 23 different developed stock markets.
Eight of the ten largest individual stocks tracked are American, including Apple and Microsoft, and 60% of the assets are weighted towards the USA.
These articles are for information purposes only and are not a personal recommendation or advice. All data shown is correct at the time of writing.
View all World Investment Outlook articles