Archived article
Please note that tax, investment, pension and ISA rules can change and the information and any views contained in this article may now be inaccurate.

British ballot boxes will be busy in 2016. Citizens in Wales and Northern Ireland will also get to exercise their democratic right in 2016, while the Scots also go to the polls in May in what could turn out to be a referendum for a referendum.
Conservative Prime Minister David Cameron will have another vote on his mind, as he may also have to set the timetable for a referendum on Britain’s membership of the European Union and a possible ‘Brexit’.
In addition a new Mayor will be elected in London, the third such appointment since the role was established in 2000.

On the economic front, November’s meeting of the Monetary Policy Committee was interpreted by some to mean that the Bank of England may only raise the base interest rate from its historic low of 0.5% in 2017.
Any interest rate hikes are likely to be gradual, placing a further premium on reliable sources of income, especially as history shows the FTSE All-Share can get choppy when the Bank of England embarks upon a fresh rate-rise cycle.
Economics
Interest rates will dominate economic discussions in 2016, as 2015 passes by without the widely anticipated first increase during Mark Carney’s tenure as Governor of the Bank of England.
Carney is citing weak wage growth, financial market volatility, a strong pound and slowing overseas economy as good reasons for standing pat. It seems unlikely he will move to increase borrowing costs before Janet Yellen, his opposite number at the US Federal Reserve, does so first.
UK base rates remain anchored at 0.5% and inflation is still subdued

Source: Thomson Reuters Datastream
Bobbling along
Consultancy the Centre for Economics & Business Research (CEBR) believes the UK’s economy will grow 2% in 2016, down from the 2.5% rate of progress it expects for 2015. For good measure, the CEBR does not expect inflation as measured by the consumer price index (CPI) to reach the Bank of England’s 2% target until 2017.
This may explain why Governor Carney was quite so dovish in his November briefing, which served to push back expectations for the first rate rise all the way through to 2017.
UK GDP growth may decelerate in 2016

Source: Thomson Reuters Datastream, CEBR estimates
Austere times
One grateful beneficiary of low interest rates is Chancellor of the Exchequer George Osborne as they make it cheaper to service the UK’s debts. For all of the fury that his deficit-reduction narrative provokes, reductions in the Government’s borrowing requirements are proving hard won.
When he first moved into 11 Downing Street in 2010, Osborne intended to erase the annual deficit by 2016. That timetable has slipped to 2019.

The bond market does not seem unduly distressed. Ten-year Gilt yields have risen from an all-time low of 1.36% in January 2015 but have failed to make a sustained break above the 2.0% level at the time of writing.
Such a low yield would be remarkable given the scale of the UK’s debts, were it not for the effects of QE and low interest rates and the relentless quest for yield they force pension providers, insurance companies and investors alike to consider.
UK 10-year Gilt yield seems to draw support from the 2% threshold

Source: Thomson Reuters Datastream
Markets
The FTSE 100 broke new ground in 2015 when it motored past the 7,000 mark for the first time. However, it stayed above that threshold for just 46 days before rattling back below 6,000, weighed down by a global growth scare and deflation fears.
As the year draws to a close, the UK, as benchmarked by the FTSE 100, is down for the year, although dividend payments are keeping the loss to the low single digits.
The FTSE 100 failed to hang on to a new all-time high in 2015
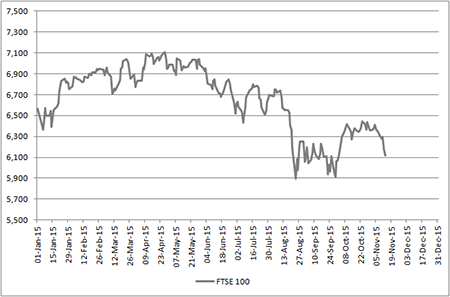
Source: Thomson Reuters Datastream
Manic miners
This disappointing performance can be blamed on the FTSE 100’s mix. The benchmark represents some 85% of the UK’s total market cap and it is very reliant on just four sectors: banks, oils, miners and insurers represent some 38% of the premium index’s market value, as well as 51%, 50% and 55% of its sales, pre-tax profits and dividends, as forecast by analyst consensus for 2016.
If the UK market is to get a wiggle on in 2016, these four areas in particular need to put in a better showing. Big downgrades at the miners and oils in particular mean aggregate analyst consensus pre-tax profit for the FTSE 100 in 2016 reaches £170.5 billion, some 7% below the 2010 figure.
FTSE 100 earnings are expected to rise by 10% in 2016
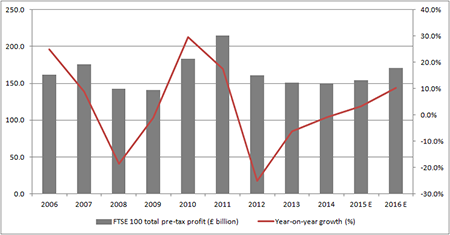
Source: Digital Look, analyst consensus
Even if analysts expect 10% earnings growth on a bottom-up basis for 2016, history suggests these numbers will be scaled back as the year develops.
Investors also need to be aware that the FTSE All-Share can be sluggish if and when it sniffs an interest rate increase.

There have been 10 cycles of higher interest rates in the UK since 1965 and the table below shows how the index has performed before and after the first move.
The point of maximum uncertainty looks to be when investors are waiting for the Bank of England to act – so perhaps it would be best for everyone were Mark Carney to just get on with it.
FTSE All-Share has historically struggled around the time of the first rate rise
| Rate hike cycle | Before first rate hike | After first rate hike | ||||||||
| From | To | From | To | 1 year | 6 months | 3 months | 3 months | 6 Months | 1 Year | 2 years |
| 18-Oct-67 | 17-Nov-67 | 5.5% | 8.0% | 27.5% | 15.8% | 11.0% | 2.3% | 23.2% | 36.7% | 18.0% |
| 22-Jun-72 | 13-Nov-73 | 5.0% | 13.0% | 29.5% | 11.0% | -4.2% | -3.6% | 4.8% | -8.5% | -44.8% |
| 26-Apr-76 | 07-Oct-76 | 9.0% | 15.0% | 18.0% | 8.8% | -2.2% | -7.0% | -27.5% | 6.6% | 23.6% |
| 28-Nov-77 | 15-Nov-79 | 5.0% | 17.0% | 54.6% | 7.6% | 0.5% | -4.8% | 6.2% | 11.0% | 13.0% |
| 06-Jul-84 | 28-Jan-85 | 8.9% | 13.9% | 9.8% | 1.4% | -5.0% | 9.0% | 19.4% | 23.8% | 66.4% |
| 03-Jun-88 | 06-Oct-89 | 7.4% | 14.9% | -15.6% | 17.3% | 1.1% | -3.4% | -2.3% | 15.5% | 24.1% |
| 13-Sep-94 | 11-Feb-95 | 5.1% | 6.6% | 4.0% | -3.0% | 3.1% | -6.4% | -5.5% | 12.2% | 24.9% |
| 30-Oct-96 | 04-Jun-98 | 5.7% | 7.5% | 13.1% | 2.0% | 7.1% | 5.9% | 9.4% | 16.7% | 28.3% |
| 08-Sep-99 | 10-Feb-00 | 5.0% | 6.0% | 19.2% | 3.6% | -0.9% | 5.2% | 4.5% | 7.7% | -16.6% |
| 06-Nov-03 | 05-Jul-07 | 3.5% | 5.8% | 7.8% | 10.9% | 6.6% | 2.5% | 4.8% | 10.0% | 27.0% |
| AVERAGE | 12.8% | 5.9% | 0.4% | -1.4% | 1.8% | 9.7% | 17.9% | |||
Source: Thomson Reuters Datastream
Vexing valuation
With momentum a bit lacking investors may therefore need to make a value case for the UK market.
A straightforward price/earnings multiple suggests the UK is roughly fairly valued, trading at just under 17 times, compared to a post-1993 average of 16.4 times.
On an earnings basis, the UK looks relatively fairly valued

Source: Thomson Reuters Datastream
Dividends tend to be a bit more predictable than earnings, as company bosses are generally reluctant to cut them – it may hit their own pocket and also attract a lot of criticism from frustrated shareholders. This means dividend yield can be one useful valuation tool, and the 4.0% on offer from the FTSE 100 compares to its post-1986 average of 3.6%, to suggest UK stocks on this measure may be a fraction cheap.
FTSE 100 offers a higher-than-average dividend yield

Source: Thomson Reuters Datastream
The key question here, though, is whether those dividends are reliable. Eight FTSE 100 companies have already cut their shareholder distribution in 2015 so investors must do their research, checking out dividend cover and balance sheets, if looking for income picks. Alternatively this job can be outsourced to a fund manager.
How to access UK markets
Investors seeking exposure to the UK market are spoiled for choice. According to data from Morningstar there are 229 OEICS which focus on UK large-cap stocks alone. The table below highlights the top five performers among those who specialise in income, over a five-year view.
Investment trusts have a loyal fan club and around 30 seek to provide clients with much-needed income. A further 18 target UK-quoted small caps and 16 more invest across firms of all shapes and sizes.
Meanwhile, exchange-traded funds (ETFs) continue to proliferate. There are now more than a dozen ETFs that provide exposure to large cap UK equities and do so simply by tracking the leading benchmark indices. The lowest ongoing charge figure here is 0.07% at the £3.5 billion iShares Core FTSE 100 while the average across the lot is 0.24%.
Best performing UK equity income OEICs over the last five years
| OEIC | ISIN | Fund size £ million |
Annualised five- year performance | Twelve-monthYield | Ongoing charge | Morningstar rating |
| PFS Chelverton UK Equity Income B (Acc) | GB00B1Y9J570 | £427.9 | 15.8% | 4.97% | 0.92% | ***** |
| Royal London UK Equity Income M GBP (Acc) | GB00B8Y4ZB91 | £1,802.2 | 12.7% | 4.42% | 0.67% | ***** |
| Evenlode Income B (Acc) | GB00B40SMR25 | £357.3 | 11.8% | 4.18% | 0.95% | ***** |
| Troy Trojan Income O (Acc) | GB00B01BP176 | £2,398.4 | 11.6% | 4.05% | 1.02% | **** |
| Old Mutual UK Equity Income R (Acc) | GB00B1XG9045 | £185.0 | 10.8% | 4.80% | 0.90% | **** |
Source: Source: Source: Morningstar, for UK Equity Income category. Accumulation units only.
Where more than one class of fund features only the best performer is listed.
Best performing UK equity income investment companies over the last five years
| Investment company | EPIC | Market cap (£ million) |
Annualised five- year performance * | DividendYield | Ongoing charges ** | Discountto NAV | Gearing | Morningstarrating |
| Small Companies Dividend | SDV | 31.3 | 23.4% | 3.9% | n/a | -11.3% | 26% | n/a |
| City of London | CTY | 1,173.2 | 23.1% | 4.1% | 0.42% | 1.5% | 11% | ***** |
| Finsbury Growth & Income | FGT | 663.1 | 16.7% | 2.1% | 0.82% | 0.0% | 4% | ***** |
| Lowland | LWI | 347.9 | 15.5% | 3.2% | 0.88% | -1.8% | 18% | **** |
| Perpetual Income & Growth | PLI | 956.5 | 15.4% | 3.5% | 1.23% | -0.5% | 19% | ***** |
Source: Source: Morningstar, The Association of Investment Companies, for the UK Equity Income category. * Share price. ** Includes performance fee
Best performing UK Large-Cap Blend Equity ETFs over the past five years
| ETF | EPIC | Net assets £ million |
Annualised five-year performance | Dividend yield | Fund OngoingCharge | Morningstar rating | Replicationmethod |
| iShares UK Dividend UCITS ETF (GBP) | IUKD | 857.2 | 8.69% | 5.28% | 0.40% | *** | Physical |
| db x-trackers FTSE All-Share UCITS ETF (DR) 1D | XASX | 119.9 | 6.09% | 0.39% | 0.40% | *** | Physical |
| iShares Core FTSE 100 UCITS ETF (Dist) | ISF | 3,727.0 | 5.06% | 3.72% | 0.07% | *** | Physical |
| HSBC FTSE 100 UCITS ETC | HUKX | 157.2 | 4.85% | 3.75% | 0.35% | ** | Physical |
| PowerShares FTSE RAFI UK 100 UCITS ETF(GBP) | PRSU | 25.3 | 3.99% | 4.09% | 0.50% | ** | Physical |
Source: Source: Morningstar, for UK Large-Cap Blend Equity category. Physical ETFs only.
Where more than one class of fund features only the best performer is listed.
AJ Bell’s top trackers for the UK
AJ Bell’s free investment guidance service is based on our list of sixteen Top Trackers and they feature no fewer than four share-related trackers, as well as three bond-related ones and one property ETF which all directly relate to the UK.
The one tracker which is featured in all three of the global tracker portfolios – Cautious, Balanced and Adventurous – is the SPDR FTSE UK All-Share, which has the EPIC code of FTAL and a SEDOL of B7452L4.
This does not feature in the table of top-performing trackers as it only began trading in February 2012 and therefore lacks a five-year performance record.
These articles are for information purposes only and are not a personal recommendation or advice. All data shown is correct at the time of writing.
View all World Investment Outlook articlesRelated content
- Tue, 12/03/2024 - 15:33