Archived article
Please note that tax, investment, pension and ISA rules can change and the information and any views contained in this article may now be inaccurate.
“The CME Fedwatch tool is putting an 84% chance on a three-quarter percentage point increase and a 16% chance on a full one-point hike from the US Federal Reserve at its latest meeting, but financial markets are already wrestling with just how far the American central bank is prepared to go in its new-found zeal to fight inflation,” says AJ Bell investment director, Russ Mould.
“Wobbly share prices, rising bond yields and a soaring dollar all suggest the answer is ‘higher still’ and the biggest clue of all could be coming from the yield on US two-year Government bonds, or Treasuries.
“The 10-year Treasury is usually seen the benchmark for US Government debt and the ‘risk-free rate’ by which the relative attractiveness, or otherwise, of all other investment options and asset classes are judged. The 10-year yield looks to offer some guide as to the direction and possible limit of US interest rates if history is any guide and going into Wednesday’s Fed meeting it stands at 3.57%, whereas the Fed Funds rate is 2.50%. A three-quarter or one-point hike would go a long way to closing the gap.

Source: Refinitiv data
“But when it comes to where the US Federal Reserve is prepared to take interest rates, the two-year paper seems to be an even better indicator. Although investors must accept that the past is absolutely no guarantee for the future, the US bond market seems pretty good at working how far the Fed can push headline interest rates before something breaks – either the stock market, the economy, or both – and it has to pivot and start cutting again.

Source: Refinitiv data
“Going into Wednesday’s Fed meeting, the two-year Treasury yield stands at 3.96% against the 2.50% Fed Funds rate. That would suggest there are further hikes to come and a move toward 4.00% on the Fed Funds is nailed on.
“Markets seem to agree as they are pricing in a peak of around 4.50% by the Federal Open Markets Committee meeting of May 2023, before the first cuts come in the second half of next year.
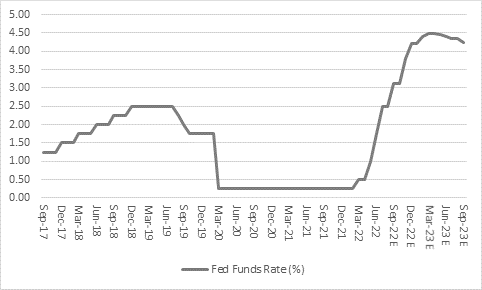
Source: Refinitiv data
“Bond vigilantes clearly believe the Fed has more work to do, with both interest rate increases and Quantitative Tightening, if it is to rein in inflation and the economic damage that it can do.
“But the US central bank is in a very tricky spot because the US bond market already thinks a recession is coming, at least if the yield curve is any guide.
“Usually, the further away the maturity (or lifespan) of the bond the higher the yield it must offer to compensate holders for the greater risks involved. The longer the life of the bond, the more scope there is for something to go wrong in the form of inflation, higher interest rates or even default.
“Right now, the yield on two, three, five, seven, ten, twenty and thirty-year paper is below that of the US one-year Treasury bill. This is known as an inverted yield curve and it is often seen as a sign that recession is coming, because it implies the Fed will start to cut rates at some stage in the future to try and stimulate growth.

Source: Refinitiv data
“This can be seen in the shorthand summary of the yield curve, namely the yield differential between the two-year and ten-year Treasury. This indicator does occasionally give false signals but 2s-10s inversions, whereby the ten-year yield is below that of the two-year instrument, forewarned of US recessions in the early 1980s, early 1990s, the turn of the Millennium and a good year before the Great Financial Crisis broke out.
“The 2s-10s curve has been inverted since late July and it is now at its most inverted since autumn 2000, when the stock market technology bubble was bursting and dragging the US into recession amid an investment bust.
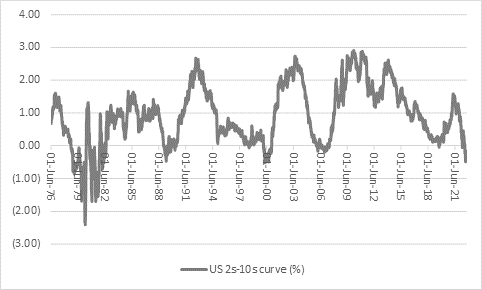
Source: Refinitiv data
“The Fed has a dual mandate, inflation and employment, and its emphasis on the former now must threaten the latter, with US central bank officials seemingly accepting a recession as a near-term price they are willing to pay to ensure longer-term price stability.
“When the 2s-10s curve inverts, the Fed usually starts cutting interest rates and easing monetary policy, just as it did in 1990-1991, 2000-2003 and 2007-2009 (as well as 2020 when covid broke out and the curve flattened but did not quite invert).
“The exception was the late 1970s and early 1980s when the Paul Volcker-led Fed tolerated the recessions of 1980 and 1981-82 as it jacked interest rates up to a peak of 19.0% to combat double-digit rates of inflation.

Source: Refinitiv data
“The Fed is once more raising rates as the yield curve inverts and the risk of a recession is therefore so much greater. No wonder the German economist and professor at MIT, Rudi Dornbusch, once asserted that ‘No post-war recovery has died in bed of old age – the Federal Reserve has murdered every one of them.’”
These articles are for information purposes only and are not a personal recommendation or advice.
Related content
- Wed, 01/05/2024 - 18:32
- Wed, 24/04/2024 - 10:37
- Thu, 18/04/2024 - 12:13
- Thu, 11/04/2024 - 15:01
- Wed, 03/04/2024 - 10:06