Archived article
Please note that tax, investment, pension and ISA rules can change and the information and any views contained in this article may now be inaccurate.
“The stock market may well have its say on the new Prime Minister, but the response of the Government bond – or Gilt – market and the pound may be more telling, at least in the very short term,” says AJ Bell investment director Russ Mould.
“Financial markets express their faith – or lack of it – in a country and its economic and political prospects through how much they charge it to borrow and how they value its currency. In each case traders and investors are already turning away, presumably because they do not like what they see.
“If Liz Truss can put an end to the sell-off in both the UK government bond market and sterling that would be a major coup, although the odds do seem to be stacked against them, as they juggle 40-year high inflation, the threat of a recession, an energy crisis, war in Ukraine, the weak pound, rising interest rates and the Government’s own state of penury.
“Sterling continues to lose ground against the dollar, and it is trading below $1.1500 for the first time since 1985. Technical analysts – or chartists – may be tempted to argue that if $1.1500 really gives way then a drop to $1.0500 is on the cards, the low seen in spring 1985.
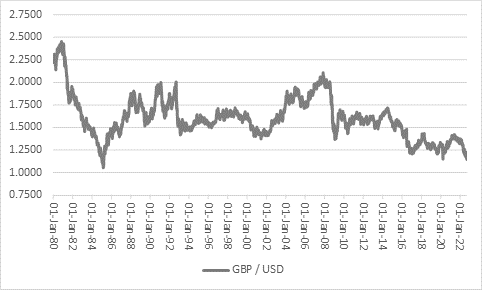
Source: Refinitiv data
“That was the year when the G5, as they were then, struck the Plaza Accord to rein in a rampant dollar and right now the dollar is strong across the board once more. As such, you can try to argue that the dollar is not a fair benchmark for sterling, except the pound is stumbling against the energy-crisis-hit euro, too.
“At €1.1573, the pound is back to where it was against the single currency in summer 2021, despite the EU’s own deep energy and economic woes.
“A weak pound can help exports, but it also increases import costs and that is not ideal at a time when inflation is already galloping higher.

Source: Refinitiv data
“Sterling may be sliding but Government borrowing costs are soaring, to suggest that the bond market does not think too much of what it sees in the UK, either – although the Bank of England’s interest rate rises in its belated battle to rein inflation back in has a big role to play here, too.
“While still low by historic standards, the yield on the benchmark UK Government bond, or Gilt, is a full percentage point higher than a year ago. At 2.92%, the 10-year Gilt yield is within touching distance of 3.00% for the first time since early 2014.
“This is in recognition of the surge in inflation, and also the Bank of England’s shift to raising interest rates and toward Quantitative Tightening. That adds to the Government’s interest bill on its £2.4 trillion debt and potentially limits scope for spending or tax cuts.

Source: Refinitiv data
“Worse still, the yield curve is now inverted.
“Normally, the yield on the 10-year Gilt is higher than that of the 2-year paper, as bondholders demand a higher return to compensate themselves for the greater risk represented by the longer holding period.
“That additional time means there is more scope for things going wrong. From a bond investor’s point of view this usually means inflation, interest rate increases or – in a worst case – default and the borrower proves unable to pay the coupons or return the original investment in full once the bond matures.
“In August, however, the yield on the 2-year Gilt moved up faster than that of the 10-year, with the result that the shorter-term paper offers a higher yield.
“This is usually a sign that the bond market is pricing in a recession, as it anticipates future interest rate cuts, and thus a drop in borrowing costs.
“It is by no means a flawless indicator – nothing is ever that easy from an investment point of view – but the UK yield curve inverted ahead of the 1991-92 downturn and the deeper 2007-09 recession. While the inversions of 1998 and 2000 proved false signals, they did reflect concerns over the potential for the stock market’s bust in technology, media and telecoms stocks to spill into, and weigh on, the real economy.
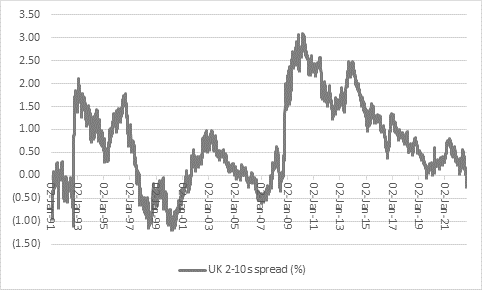
Source: Refinitiv data
“Stock market investors, as well as bondholders and currency traders, will be watching the yield curve very closely. It does not invert often, at least if the last 30 years are any guide, but it can be a warning of trouble ahead for holders of UK equities.
“The FTSE All-Share dipped briefly into a bear market in 1989-90, wobbled in 1998 thanks to the Asian and Russian debt crises, plunged in 2000-2003 as the tech bubble burst, collapsed in 2007-09 as the Great Financial Crisis struck. On each occasion the yield curve had inverted, although the indicator did briefly give a false signal in August 2019.

Source: Refinitiv data
“The new Prime Minister will find themselves potentially trapped between the lesser of two evils of inflation on one side and recession on the other. If the financial markets like what they hear then that may help to hold Gilt yields in check, the yield curve to steepen and the pound to rally. If not, then yields could rise, the curve continue to invert and sterling may keep sliding.”
These articles are for information purposes only and are not a personal recommendation or advice.
Related content
- Wed, 01/05/2024 - 18:32
- Wed, 24/04/2024 - 10:37
- Thu, 18/04/2024 - 12:13
- Thu, 11/04/2024 - 15:01
- Wed, 03/04/2024 - 10:06