Archived article
Please note that tax, investment, pension and ISA rules can change and the information and any views contained in this article may now be inaccurate.
“As he tried to rally his people during the Great Depression of the 1930s, US President Franklin D. Roosevelt may have asserted that ‘The only thing to fear is fear itself,’ but from a stock market point of view it is lack of fear that usually causes problems, as investors take more risk than they would do normally, overpay for assets and allocate capital with gay abandon,” says AJ Bell Investment Director Russ Mould.
“That is what usually leads to trouble down the road and so far in 2020 the VIX index, or ‘fear index’ has not reached 40 once and markets have bubbled along happily as a result.
“The VIX reached 37 in January and has just crossed the 30 mark again in early December, as markets have fretted about Turkey’s latest currency meltdown, the Omicron variant of covid-19 and whether the Federal Reserve and the Bank of England will start to tighten monetary policy more quickly than expected.
“Lows in the VIX have a history of coming near equity index highs (since this is when fear is at its lowest and animal spirits at their strongest) and peaks in the ‘fear index’ tend to coincide with market lows (when confidence is absent and worries are running wild).
“The question investors now need to ask themselves is whether this bout of angst is yet another chance to simply pile in and buy on the dip or a sign of more troubling times to come after a rip-roaring run for most stock market indices, as well as commodities, cryptocurrencies and a host of other asset classes.

Source: Refinitiv data
“The VIX is trading well above its historic average of 19, after all, and this would suggest that investors might be tempted to dip back into stocks, especially if the science shows that the Omicron variant is less transmissible or less deadly or just as treatable with current vaccines, relative to previous strains of covid-19.
“However, signs of stress in more peripheral markets could counsel caution. Financial market history shows that trouble tends to show first in the outer reaches, where investors are taking more risk by design, and slowly moves toward more core area as fear builds, risk appetite ebbs and portfolio-builders seek safety.
“It is possible to argue that investors are taking evasive action in some of the riskier areas because emerging markets, cryptocurrencies and early-stage tech stocks are wobbling.
“Emerging equity markets have done poorly all year, at least relative to developed ones and the ongoing woes of Chinese property developer Evergrande, a slew of interest rate rises in the face of surging inflation and Turkey’s latest currency meltdown are all possible reasons for this. Ankara’s unorthodox monetary policies remain a source of concern and although there are few signs of contagion to other markets right now, not least because Western banks seem to have reduced their exposure to Turkey since 2018’s lurch lower in the lira, all it would take is the imposition of currency controls by the Central Bank of the Republic of Turkey for the situation to become much more serious.
“Malaysia imposed capital controls in 1998 and international investors who were stuck with assets stranded in ringgit sold stocks and bonds in other emerging markets to raise liquidity and protect themselves from the danger of similar moves elsewhere. That eventually rippled around the world and what began as an Asia currency and debt crisis in 1997 became a global one in 1998 and even the FTSE 100 was caught up the melee as it briefly entered a bear market.
“None of this is to say that we get a repeat this time, or that Ankara makes the same mistakes as Kuala Lumpur did 22 years ago, but it is a risk that must be watched and investors are clearly treading warily when it comes to emerging markets.

Source: Refinitiv data
“Bitcoin has endured its latest thumping over the weekend and has gone back below $50,000.
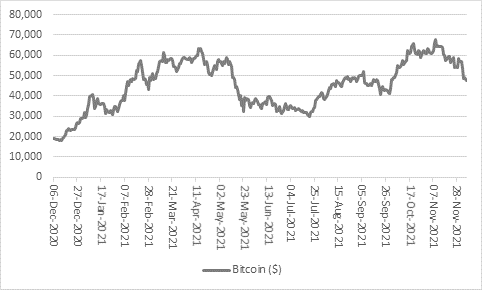
Source: Refinitiv data
“And Cathie Wood’s ARK Innovations Exchange-Traded Fund, that is packed with potentially disruptive technology names such as Tesla, Teladoc, Roku, Coinbase, Square and Twilio is deep in its own private bear market. The NASDAQ Composite may be only 6% off its highs but the ARK Innovations ETF is down by 18% over the past year and now stands some 40% below its February peak. Someone, somewhere is taking the view to move away from highly-valued technology stocks where a lot of growth is already priced in and the value of their future earnings declines if interest rates and discount rates go up.
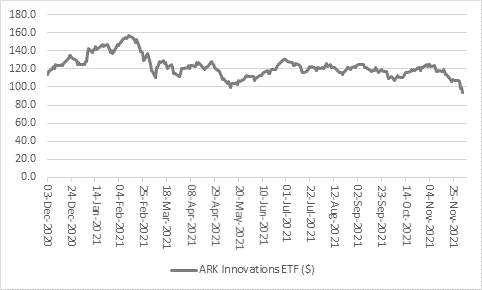
Source: Refinitiv data
“None of this means that mainstream equities are about to fall out of bed. Again, some investors may view this latest loss of nerve as a contrarian signal to buy, especially as any prolonged signs of a taper tantrum have prompted central banks to back off plans to tighten monetary policy and there is no guarantee at all that the Fed or Bank of England will follow through this month on their narrative that inflation is running too hot for comfort and that action may be warranted as a result.
“Nor is the ultimate haven asset, gold, showing any sign of life. It is refusing to shine and gold bugs are sat on a paper loss of around 6% this year.
“A study of the VIX makes this less surprising, as gold tends to thrive when risk appetite and confidence really are in retreat. A year without a VIX reading over 40 is not the environment for gold.
“It would take a more sustained stumble for the metal to shine, but if central banks fudge their next policy announcements and markets’ faith in their desire or ability to fight inflation starts to crumble then gold could yet forge another run toward $2,000 an ounce. For the moment, however, markets seem happy to buy into the narrative that central banks have their back and that they are in control of the situation.”
| Number of VIX readings of 40+ | S&P 500 annual return (%) | Gold annual return in $ (%) | |
|---|---|---|---|
| 1990 | 0 | (6.60%) | (2.40%) |
| 1991 | 0 | 26.30% | (9.80%) |
| 1992 | 0 | 4.50% | (5.70%) |
| 1993 | 0 | 7.10% | 17.30% |
| 1994 | 0 | (1.50%) | (2.00%) |
| 1995 | 0 | 34.10% | 1.10% |
| 1996 | 0 | 20.30% | (4.50%) |
| 1997 | 0 | 31.00% | (21.80%) |
| 1998 | 15 | 26.70% | (0.50%) |
| 1999 | 0 | 19.50% | 1.10% |
| 2000 | 0 | (10.10%) | (6.20%) |
| 2001 | 4 | (13.00%) | 1.40% |
| 2002 | 11 | (23.40%) | 24.00% |
| 2003 | 0 | 26.40% | 21.60% |
| 2004 | 0 | 9.00% | 5.00% |
| 2005 | 0 | 3.00% | 17.00% |
| 2006 | 0 | 13.60% | 23.80% |
| 2007 | 0 | 3.50% | 31.80% |
| 2008 | 64 | (38.50%) | 3.10% |
| 2009 | 67 | 23.50% | 27.10% |
| 2010 | 3 | 12.80% | 29.30% |
| 2011 | 11 | 0.00% | 11.10% |
| 2012 | 0 | 13.40% | 5.60% |
| 2013 | 0 | 29.60% | (27.30%) |
| 2014 | 0 | 11.40% | (1.80%) |
| 2015 | 1 | (0.70%) | (10.40%) |
| 2016 | 0 | 9.50% | 9.00% |
| 2017 | 0 | 19.40% | 12.60% |
| 2018 | 0 | (6.20%) | (1.70%) |
| 2019 | 0 | 28.90% | 18.70% |
| 2020 | 35 | 15.50% | 24.70% |
| 2021* | 0 | 21.60% | (6.10%) |
Source: Refinitiv data. *2021 to date.
These articles are for information purposes only and are not a personal recommendation or advice.
Related content
- Wed, 01/05/2024 - 18:32
- Wed, 24/04/2024 - 10:37
- Thu, 18/04/2024 - 12:13
- Thu, 11/04/2024 - 15:01
- Wed, 03/04/2024 - 10:06