Archived article
Please note that tax, investment, pension and ISA rules can change and the information and any views contained in this article may now be inaccurate.
“The autumn stock market sell-off has boosted the forecast dividend yield for the FTSE 100 to 4.9% for 2019. Dividends paid out by the UK’s blue chip index are forecast to hit a new all-time high of £93.7 billion next year and as share prices have fallen this has pushed up the forecast dividend yield, providing a source of support for UK stocks amongst the maelstrom of political uncertainty.", says Russ Mould, Investment Director at AJ Bell.
“Such a fat yield looks extremely tempting compared to the Bank of England’s 0.75% base rate for cash and the 1.23% yield on the benchmark UK ten-year Gilt.
Top ten forecast dividend yields for the FTSE 100 in 2019
| Dividend yield 2019e | Earnings cover 2019e | |
| Taylor Wimpey | 13.10% | 1.19x |
| Evraz | 12.10% | 1.09x |
| Persimmon | 11.80% | 1.20x |
| Barratt Developments | 9.60% | 1.51x |
| Standard Life Aberdeen | 9.60% | 1.01x |
| Direct Line | 8.90% | 1.10x |
| Imperial Brands | 8.70% | 1.36x |
| Aviva | 8.60% | 1.84x |
| Centrica | 8.40% | 1.09x |
| Vodafone | 8.30% | 0.75x |
| Average | 1.21 x |
Source: Company accounts, Digital Look, analysts’ consensus forecasts
“In terms of the highest yields, the presence of three house builders in the top ten is testimony to the size of their capital return programmes, but it may also hint at investor scepticism that the industry can maintain its current lofty levels of profitability without the benefit of Government assistance, via the Help to Buy and Lifetime ISA schemes. That said, Help to Buy has been extended again so it is possible that these payments are well underpinned, if unwittingly, by the taxpayer.
“Sceptics will point to how average dividend cover is just 1.21 times for the ten highest yielders, which is certainly lower than ideal. The lowly earnings cover partly reflects the lofty expected pay-outs at the three house builders, even though all three do have net cash balance sheets to reassure shareholders.
“Of greater concern may be Standard Life Aberdeen, where a long streak of dividend increases is under threat according to consensus forecasts, and Vodafone, where the shareholder distribution is not expected to grow for the first time in two decades.
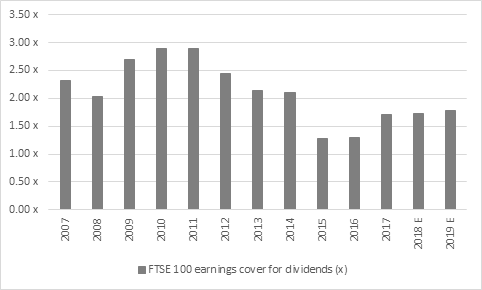
Dividend (or earnings) cover
“Earnings cover for the FTSE 100 dividends as a whole is a more respectable 1.79 times for 2019 according to analysts’ forecasts. Although this is a four-year high, earnings cover has remained below the comfort zone of 2 times or more since 2014.
“Ideally earnings cover needs to be around that 2.0 times mark to offer a margin of safety to dividend payments, should there be a sudden and unexpected downturn in trading at a specific company, or indeed the UK and global economies as a whole.
Source: Company accounts, Digital Look, analysts’ consensus forecasts
“It is possible to argue that the dividend cover figure is skewed by the low cover on offer at huge dividend payers. Of the 10 largest forecast payers in actual cash terms, none are expected to offer dividend cover above two times. However, improved earnings at Shell and BP have taken cover there to 1.72 times and 1.45 times, and this is supporting the overall FTSE 100 earnings cover ratio.
“These ten firms are expected to pay out 54% of the FTSE 100’s total dividends in 2019 so concentration remains an issue of which investors need to be aware, even if they are seeking exposure to UK stocks via an actively or passively managed fund.
| Forecast percentage contribution to FTSE 100 cash dividend payments in 2019E | Dividend cover 2019E | |
| Shell | 13% | 1.72x |
| HSBC | 9% | 1.47x |
| BP | 7% | 1.45x |
| BAT | 5% | 1.73x |
| GlaxoSmithKline | 4% | 1.76x |
| Vodafone | 4% | 1.51x |
| Rio Tinto | 3% | 1.20x |
| AstraZeneca | 3% | 0.99x |
| Lloyds | 3% | 1.70x |
| Glencore | 3% | 1.32x |
| Average | 1.49x |
Source: Company accounts, Digital Look, analysts’ consensus forecasts
Total FTSE 100 dividend payments and year on year change:
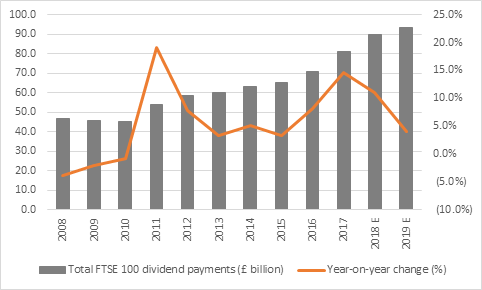
Source: Digital Look, company accounts, analysts’ consensus dividend forecasts
These articles are for information purposes only and are not a personal recommendation or advice.
Related content
- Wed, 01/05/2024 - 18:32
- Wed, 24/04/2024 - 10:37
- Thu, 18/04/2024 - 12:13
- Thu, 11/04/2024 - 15:01
- Wed, 03/04/2024 - 10:06