Archived article
Please note that tax, investment, pension and ISA rules can change and the information and any views contained in this article may now be inaccurate.
“After a stumble in spring, amid the Cambridge Analytica data scandal and broader worries over regulation, trade and tariffs, technology stocks are surging higher once more. The Fang+ index in America, which consists of ten high-flyers in total, has just passed the 3,000 level for the first time. It took the benchmark just 1,365 days to get there after its launch at 1,000 in autumn 2014. By contrast it took the NASDAQ Composite 1,570 days to get from 1,000 to 3,000 between July 1995 and November 1999,” says Russ Mould, AJ Bell Investment Director.
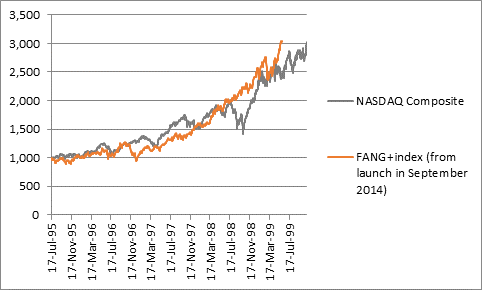
Source: Thomson Reuters Datastream
“Some investors will argue the Fang+ index’s momentum is a good thing, not least because the NASDAQ passed the 5,000 mark just four months after it hit 3,000, offering further huge gains to buyers of tech stocks. And the Fang+ index is up by 37% so far in 2018, while the NASDAQ had advanced by ‘just’ 20% at the same stage in 1999, so the Fang+ index is rising even faster.
“Other investors will however dolefully point out how the NASDAQ’s seemingly relentless progress came to a crashing end. The index peaked at 5,048 in mid-March 2000 and it had plunged to 1,114 before it finally hit bottom in October 2002, for a juddering 78% fall. It then took the NASDAQ until July 2016 – or nearly fourteen years – to get back to its prior high.”
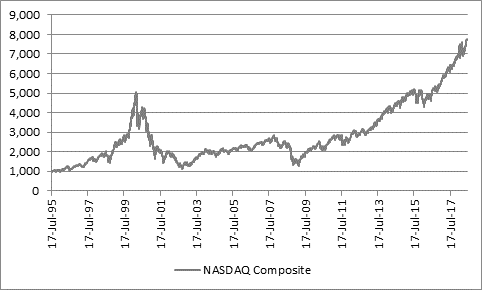
Source: Thomson Reuters Datastream
“Those who remember how the technology, media and telecoms bubble burst will be shaking their heads at how shares in Facebook, Apple, Amazon, Netflix and Alphabet (Google’s parent) are currently performing, as it will remind them of the run-up to March 2000, when the higher the NASDAQ went, the more bullish analysts and investors became.
“The NASDAQ’s collapse in 2000 to 2002 does look to offer a stark warning to those investors who are arguing that it is different this time, not just with regard to the big five FAANG stocks, but also the five other members of the Fang+ index, Nvidia, Tesla, Baidu, Tencent and Twitter.
“It is noticeable that any investor who bought the world’s five biggest tech stocks in March 2000, when the NASDAQ peaked, would have lost money on three of those five picks and wiped out nearly a quarter of their investment in capital terms over the subsequent 18 years.
“And they suffered those falls even though four of those five firms delivered massive profits growth over that period. Since March 2000, aggregate annual profits at Microsoft, Cisco, Intel, Oracle and Nokia have marched from $21.6 billion to $79 billion (and that is despite a fall at Nokia).
“In this respect, the biggest tech firms did everything that was asked of them over the very long term. But that did not stop their shares prices falling, as they proved unable to withstand the weight of near-term expectations placed upon them by very lofty valuations.
| March 2000 peak | 2000 | ||||
| Share price | Market cap (bn) | Net income (bn) | EPS | P/E (x) | |
| Microsoft ($) | 50.5 | 525.7 | 7.76 | 0.81 | 62.3 |
| Cisco ($) | 66.18 | 466.6 | 2.1 | 0.31 | 213.5 |
| Intel ($) | 60.09 | 401.5 | 7.31 | 1.09 | 55.1 |
| Oracle ($) | 40.81 | 239.3 | 1.29 | 0.25 | 163.2 |
| Nokia (€) | 56.7 | 254.5 | 3.03 | 0.5 | 113.4 |
| NASDAQ | 5,048.20 | ||||
| Big Five aggregate | 1,897.20 | 21.6 | 87.8 | ||
| Friday 22 June 2018 | 2018E | ||||
| Share price | Market cap (bn) | Net income (bn) | EPS | P/E (x) | |
| Microsoft ($) | 101.87 | 782.7 | 29.5 | 3.84 | 26.5 |
| Cisco ($) | 43.74 | 205.7 | 12.3 | 2.62 | 16.7 |
| Intel ($) | 53.46 | 249.1 | 22.8 | 4.89 | 10.9 |
| Oracle ($) | 42.82 | 174.8 | 12.3 | 3.02 | 14.2 |
| Nokia (€) | 5.116 | 33.3 | 1.9 | 0.29 | 17.6 |
| NASDAQ | 7,692.80 | ||||
| Big Five aggregate | 1,451.40 | 79.2 | 18.3 | ||
| Change 2018 vs 1999 | 52% | -23% | 267% |
Source: Company accounts, Thomson Reuters Datastream, consensus analysts’ forecasts
“Bulls of the FAANG stocks, indeed all 10 members of the Fang+ index, can at least counter that the FAANGs are already making higher profits in aggregate than the biggest five tech stocks were back in 2000 and that – on average – their valuations are lower as a result.
| Friday 22 June 2018 | 2018E | ||||
| Share price | Market cap (bn) | Net income (bn) | EPS | P/E (x) | |
| Facebook ($) | 201.7 | 584.7 | 22.5 | 7.76 | 26 |
| Amazon ($) | 1,715.70 | 825.5 | 6.1 | 12.73 | 134.8 |
| Apple ($) | 184.9 | 906.3 | 56 | 11.42 | 16.2 |
| Netflix ($) | 411.1 | 176.8 | 1.2 | 2.89 | 142.2 |
| Google ($) | 1,169.30 | 807.2 | 28.1 | 40.7 | 28.7 |
| NASDAQ | 7,692.80 | ||||
| Big Five aggregate | 3,300.50 | 113.9 | 29 |
Source: Company accounts, Thomson Reuters Datastream, consensus analysts’ forecasts
“Nevertheless, most investors would be hard pushed to describe an aggregate forward price/earnings multiple of 29 times as a bargain – and that’s before you get to the triple-digit ratings afforded to Amazon and Netflix – even allowing for their growth prospects.
“The danger for bulls is that these valuations leave little margin for error should something – anything – go wrong. While the FAANG and Fang+ names are currently seen as almost safe haven stocks, owing to their perceived immunity from wider economic, trade or geopolitical concerns, this very perception and the valuations attributed to them could mean they are anything but safe, as anyone who does remember 1999-2000 or the rise and fall of the so-called Nifty Fifty in the early 1970s will tell you.
“The danger for bears is that near-term earnings momentum carries the Fang stocks higher, regardless of valuation, in what could turn out to be a case of ‘up they go, until they blow,’ just like 1999-2000 – and the NASDAQ did go up by a further 68% between November 1999 and March 2000, even after it had hit the 3,000 mark.”
These articles are for information purposes only and are not a personal recommendation or advice.
Related content
- Wed, 08/05/2024 - 11:46
- Wed, 01/05/2024 - 18:32
- Wed, 24/04/2024 - 10:37
- Thu, 18/04/2024 - 12:13
- Thu, 11/04/2024 - 15:01