Archived article
Please note that tax, investment, pension and ISA rules can change and the information and any views contained in this article may now be inaccurate.

No sooner had America’s technology-laden NASDAQ Composite stock index crossed the 6,000 mark for the first time in late April than two of its leading members, Amazon and Alphabet, have seen their share price reach $1,000.
The numbers in themselves mean little in absolute terms but they do signal that technology is well and truly back in fashion, some 17 years after the tech, media and telecoms (TMT) ‘bubble’ of the late 1990s came into grief.
That stock market accident proved sufficiently potent to push the USA into a brief recession and it has not been forgotten. A 1.8% one-day slide in the NASDAQ earlier this month (9 June) immediately prompted much comment from analysts and strategists about whether another bubble had formed and was primed to burst, especially after the strong returns provided by the headline index and some leading tech names:
Technology stocks have generated lofty returns in the past 12 months
| Performance over past 12 months (in $) | |||
| Index | Company | ||
| NASDAQ Composite | 28.3% | Tesla | 72.6% |
| Dow Jones Industrials | 20.3% | Netflix | 62.7% |
| S&P 500 | 17.4% | Apple | 50.6% |
| Microsoft | 40.9% | ||
| Amazon | 37.1% | ||
| 32.2% | |||
| Alphabet | 32.6% | ||
Source: Thomson Reuters Datastream
It is understandable that firms generating rapid profits increases should be coveted in what still feels like a highly-indebted, low-growth world, especially if they can do so organically rather than by acquisition.
The questions investors need to ask themselves now are:
- Does the recent market action in tech names unnerve them in any way?
- Will the buy-the-dip mentality hold – and what could make it crack (and when ?)
- If the NASDAQ does break down, how far could it go – and how would this affect their risk tolerance for tech exposure?
- What would be the broader implications be for UK and global equities?
- If they still like the sector, given how they see the risk-reward profile, how can tech exposure be gleaned in a cost-effective and efficient manner?
The rest of this week’s column will address questions one to four, but this introduction will end with our customary tables which show the best performing active and passive funds in technology.
This is a specialist area, but there over a dozen funds, two investment trusts (and three if you broaden the field a little and include the growth-oriented Scottish Mortgage) and around exchange-traded funds from which to choose, although not all of them have our preferred five-year performance history.
For the record, the Polar Capital Global Technology fund is one of the 72 collectives which form the AJ Bell Favourite Funds list, which can be found here.
Best performing technology-dedicated funds over the last five years
| OEIC | Fund size £ million | Annualised 5-year performance | 12-month Yield | Ongoing charge | Morningstar rating |
| Fidelity Global Technology W (Acc) GBP | £1,838.8 | 25.0% | n/a | 1.07% | ***** |
| JP Morgan European Technology A (Dist) - EUR | £216.7 | 24.9% | 1.34% | 1.82% | **** |
| Pictet Digital I dy (GBP) | £1,210.7 | 23.5% | n/a | 1.21% | ***** |
| Polar Capital Global Technology I (GBP) | £1,010.3 | 23.3% | n/a | 1.16% | ***** |
| Legal & General Global Technology Index I (Acc) | £178.0 | 21.4% | 0.92% | 0.32% | **** |
Source: Morningstar, for Sector Equity Technology category.
Where more than one class of fund features only the best performer is listed.
Best performing technology-dedicated investment trusts over the last five years
| Investment company | Market cap (£m) | Annualised 5-year performance * | Dividend Yield | Ongoing charges ** | Discount to NAV | Gearing | Morningstar rating |
| Allianz Technology | 263.8 | 27.7% | n/a | 1.03% | -4.0% | 0% | ***** |
| Polar Capital Technology | 1,326.0 | 22.8% | n/a | 1.10% | -0.9% | 0% | ***** |
Source: Morningstar, for Sector Specialist: Tech Media & Telecoms category
* Share price. ** Includes performance fee
Best performing technology-dedicated ETFs over the last five years
| ETF | Net assets (£m) | Annualised 5-year performance | Dividend yield | Total Expense Ratio (TER) | Morningstar rating | Replication method |
| Lyxor MSCI World Information Technology TR C-USD | 103.7 | 21.2% | n/a | 0.40% | ***** | Synthetic |
| db x-trackers Stoxx Europe 600 Technology 1C (GBP) | 66.0 | 21.1% | n/a | 0.30% | *** | Synthetic |
| Source Technology S&P US Select Sector | 503.6 | 20.8% | n/a | 0.30% | **** | Synthetic |
| db x-trackers MSCI EM Information Technology Index 1C | 8.4 | 19.9% | n/a | 0.65% | *** | Synthetic |
Source: Morningstar, for Sector Equity Technology category
Where more than one class of fund features only the best performer is listed.
Market action
The 1.8% drop seen on 9 June may have alarmed some and stirred plenty of comment but it was one of only three such negative price moves in the whole of 2017 and just eight over the past 12 months.
That is nothing compared to the wild swings seen in 1999-2000 as the NASDAQ began to top out and the bubble prepared to burst.
The first chart shows the number of daily open-to-close movements in the NASDAQ in the 12 months before its peak at 5,048 in March 2000 – there were 149 instances in 263 trading days, including 73 moves of between 2% and 4% and two above 5% (both declines):
Trading in the NASDAQ became increasingly frenzied as it neared the peak in 2000
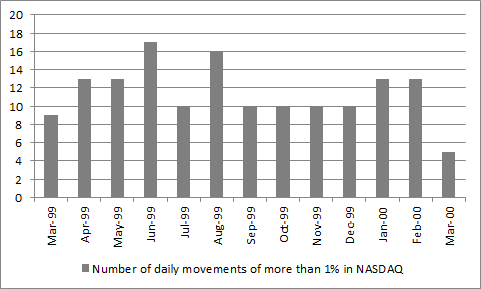
Source: Thomson Reuters Datastream
The trading patterns of the past 12 months are somnambulant by comparison.
Trading in the NASDAQ is currently much calmer
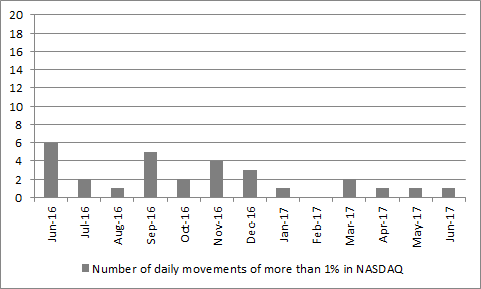
Source: Thomson Reuters Datastream
This may offer comfort to bulls, as there is little sign of the wild rises and falls which characterised 1999 as supporters and detractors of tech stocks grappled for control.
Nor have we seen the sort of final surge which characterises many a bubble - the NASDAQ’s 28% rise of the past 12 months pales next to the 110% advance witnessed in the year leading up to March 2000.
This next graphic puts the NASDAQ’s performance across both periods on the same time scale, day by day, with the last 12 months rebased to the prior episode’s starting point:
NASDAQ’s gains of past year pale compared to those of 1999-2000

Source: Thomson Reuters Datastream
Buying the dips
This may again encourage those investors with substantial exposure to technology stocks, as could the manner in which trading in the NASDAQ quickly settled after that wobble on Friday 9 June.
The ‘buy-on-the-dip’ mantra worked well in 1999-2000 and it has worked well during this up cycle – so far.
The question now is what could change that mentality to one whereby it becomes ‘sell on the rallies’?
During the author’s prior career as an investment banking analyst (covering technology stocks) one seasoned hedge fund manager once tersely noted that he would never go short of a tech stock until it had halved – because it was at this point that doubts would begin to creep in and stale bulls would look to sell rallies rather than buy dips.
That’s rather a long way down from here but investors should not be lulled into any complacency. Just look at the share price of social media phenomenon Twitter since its 2013 flotation.
It has cratered as the firm has not only failed to deliver relative to expectations but failed to deliver any profits at all – although a $12 billion market cap suggests that someone, somewhere still thinks a turn for the better is coming.
Twitter’s experiences show what could happen if tech company profits and cash flows disappoint
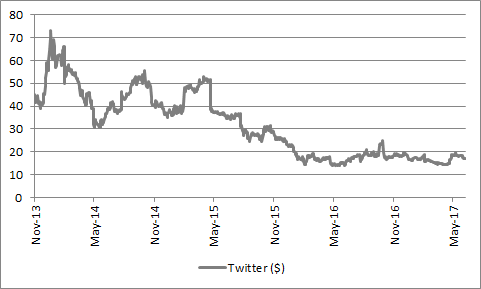
Source: Thomson Reuters Datastream
If (when?) the end comes, this is the most likely trigger – either cult stocks like Tesla or Snap don’t generate any profits or cash at all, or companies like Amazon, Facebook and Alphabet (Google’s parent) fail to meet lofty growth expectations and suddenly look awfully expensive.
The table below shows that then ten largest NASDAQ stocks by market capitalisation trade on average on a big premium to the overall US stock market on forward earnings. Amazon, Facebook and Alphabet in particular have lofty expectations to meet and beat and failure to do so could prove costly.
Valuations of the ten largest market cap stocks in the NASDAQ Composite
| Share price $ | Market cap $bn | PE (x) | ||
| 2017 E | 2018 E | |||
| Apple | 146.59 | 764.3 | 16.4 x | 14.0 x |
| Alphabet | 970.5 | 625.6 | 28.6 x | 24.0 x |
| Microsoft | 70.65 | 545.5 | 23.3 x | 21.3 x |
| Amazon | 980.79 | 468.8 | 147.0 x | 86.0 x |
| 150.68 | 356.3 | 31.1 x | 25.2 x | |
| Comcast | 41.2 | 195.0 | 20.8 x | 18.6 x |
| Intel | 35.88 | 169.0 | 12.5 x | 12.1 x |
| Cisco | 31.7 | 158.5 | 13.3 x | 12.9 x |
| Amgen | 164.4 | 120.9 | 13.3 x | 12.9 x |
| Kraft-Heinz | 91.59 | 111.5 | 24.8 x | 22.8 x |
| 3,515.4 | 22.7 x | 19.9 x | ||
Source: NASDAQ, Thomson Reuters Datastream, consensus analysts’ estimates
How low could they go?
As Twitter’s experiences suggest, when a stock loses favour it can fall fast and hard, even when a bull market is in full flow, let alone a bear one.
The bust of 2000-2003 offers a particularly cautionary experience.
The only warnings of danger ahead in 2000 were heightened market volatility and a growing number of profit disappointments, which analysts swept under the carpet, saying it would be all right in the end. It wasn’t, as valuations became so lofty they could not be justified, especially when profit misses became more frequent.
But the rout began in March 2000 quite suddenly. Without warning, the NASDAQ fell by one third in the next month. Many rallies followed but they served only to destroy those who bought on the dips, as the NASDAQ fell by 89% from peak to trough over a 31-month period.
So extreme had valuations become that the NASDAQ only got back to that 5,048 peak of 2000 in summer 2016.
The initial rout in NASDAQ in 2000 was brutal and the index offered several bear-trap rallies before it bottomed
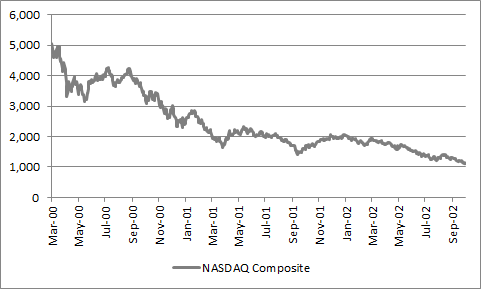
Source: Thomson Reuters Datastream
No-one can say when the next downturn will come, when it will start or how deep it will be.
But the warning here is surely that this is potentially the wrong sector for risk-averse investors at the best of times, let alone after a stonking good run where animal spirits are flowing.
After all, Tesla’s $61.7 billion market cap gives it a higher valuation than American sales volume leader General Motors, whose valuation is nearly $10 billion lower.
Tesla has never made a profit in the ten years of its existence. GM has made tens of billions.
In May, Tesla sold 4,050 cars in the USA. GM sold 237,156, or 59 times as many.
Yes, electric cars have huge growth potential and GM faces a big challenge here. But the 1999-2003 experience showed that tech changes can happen a lot more slowly than thought in the early stages, and then a lot more quickly once things get going.
Investors can draw their own conclusions about the risk-reward profile offered by current valuations and long-term potential against short-term reality, while a skilled fund manager may help investors negotiate this phase.
The table below compares the top-ten holdings list of the fund, investment trust and exchange-traded fund that have performed best over the last five years:
Top ten holdings of best-performing active and passive dedicated technology collectives
| Collective | Fund | Investment Trust | Exchange-traded fund | |||||
| Fidelity Global Technology | Allianz Technology | Lyxor MSCI World Information Tech | ||||||
| Stock | Weighting | Stock | Weighting | Stock | Weighting | |||
| 1 | Alphabet A | 9.4% | Apple | 8.7% | Apple | 13.8% | ||
| 2 | Intel | 5.9% | Amazon | 6.9% | Microsoft | 8.8% | ||
| 3 | Apple | 5.9% | Micron | 4.2% | Facebook A | 6.0% | ||
| 4 | SAP | 4.3% | Facebook A | 4.0% | Alphabet C | 5.1% | ||
| 5 | TSMC | 4.3% | Samsung Electronics | 3.8% | Alphabet A | 5.0% | ||
| 6 | Salesforce.com | 2.8% | Workday | 3.7% | Visa A | 3.0% | ||
| 7 | Activision Blizzard | 2.4% | Proofpoint | 3.1% | Intel | 2.9% | ||
| 8 | IBM | 2.4% | Square | 2.9% | Cisco | 2.7% | ||
| 9 | Fidelity ILF USD A Acc | 2.3% | DXC Technology | 2.9% | Oracle | 2.4% | ||
| 10 | Akamai Technologies | 2.1% | Microsoft | 2.8% | IBM | 2.3% | ||
| 41.9% | 43.0% | 52.0% |
Source: Morningstar, fund provider fact sheets
In the case of Lyxor MSCI World Information Technology the largest stocks in the index are provided
Broader outlook
If tech stocks do crack it would seem logical to expect US stocks to wobble at the same time. After all, the ten largest tech stocks in the S&P 500 index represent nearly 16% of its market cap.
In addition, money flows in exchange-traded funds that track the US market will currently be going into the biggest stocks, including these tech names.
That positive feedback loop could turn negative if money starts to flow out of US stocks.
Investors whose equity exposure comes predominantly from the UK may just wonder what all of the fuss is about.
Following last year’s acquisition of ARM Holdings by Japan’s Softbank the FTSE 100 has just two tech stocks in it – Sage and Micro Focus.
Between them they represent 0.6% of the headline index’s market cap and less than 0.5% of aggregate sales, profit and dividend forecasts for 2017 and 2018.
Any direct impact is therefore likely to be limited, even allowing for how media and telecoms stocks contribute a further 8% of market cap and 7% of forecast sales and profits and just over 10% of dividends, according to consensus forecasts.
The hit was much greater in 1999-2000. Thirteen tech firms sluiced into the FTSE 100 between 1998 and 2000 along with 12 media and telecoms firms) so their fall from grace had a huge impact when 12 fell out (alongside nine media and telecoms plays) during the bear market that ended in 2003.
Tech, media and telecoms stocks poured into - and then sluiced out of – the FTSE 100 during 1998-2003

Source: Thomson Reuters Datastream
That offers some succour although if sentiment has turned on a darling sector like tech, it would be unwise to argue that sentiment toward equities will not have turned more broadly too, especially as fund managers trapped in what could then be duff tech names may find themselves selling other assets where they can lock in a gain, should redemptions come thick and fast.
Russ Mould, AJ Bell Investment Director

Written by:
Russ Mould
Russ Mould has 28 years' experience of the capital markets. He started at Scottish Equitable in 1991 as a fund manager and in 1993 he joined SG Warburg, now part of UBS investment bank, where he worked as equity analyst covering the technology sector for 12 years. Russ joined Shares in November 2005 as technology correspondent and became Editor of the magazine in July 2008. Following the acquisition of Shares' parent company, MSM Media by AJ Bell Group, he was appointed AJ Bell’s Investment Director in summer 2013.
Related content
- Wed, 17/04/2024 - 09:52
- Tue, 30/01/2024 - 15:38
- Thu, 11/01/2024 - 14:26
- Thu, 04/01/2024 - 15:13