Archived article
Please note that tax, investment, pension and ISA rules can change and the information and any views contained in this article may now be inaccurate.
“It is three years since the first covid-inspired lockdown in the UK and it is still not entirely clear whether patterns of human behaviour will be affected over the long-term or not. But what is becoming increasingly clear is that stock markets’ expectations of a ‘new normal’ proved largely incorrect and the last three years have started to look like an aberration, not a brave new world,” says AJ Bell investment director Russ Mould.
“As central banks and governments have withdrawn stimulus, cryptocurrencies, initial public offerings, Special Purpose Acquisition Companies, UK gilts and now banks have all blown up at some stage, or at least wobbled, and now investors could be forgiven for worrying about what might come next, especially as policymakers keep raising interest rates.
“The collapse of Silicon Valley Bank, the UBS takeunder of Credit Suisse and fresh share price plunges in European banks are once more putting the spotlight on monetary policy and begging the question of whether central banks may already be running it too tightly, as they hike interest rates and seek to shrink their balance sheets through Quantitative Tightening (QT).
“Weak risk controls ultimately unstitched Silicon Valley Bank and Credit Suisse, but the root of their woes may not lie in the sharp interest rate increases pushed through by central banks in the past year, but with the lengthy period of zero interest rate policies (ZIRP) and Quantitative Easing (QE) which preceded them.
“A period of central bank manipulation to keep the cost of money artificially low – albeit you can argue for good reason in an era of the Great Financial Crisis, the European Debt Crisis and covid-19 – encouraged risk taking on an epic scale. As interest rates and bond yields rise, we are now discovering what may be the genuine cost of money, with the result that risk appetite wanes and capital is treated with greater respect.
“Just look at the share price chart for Silicon Valley Bank. In the technology, media and telecoms bubble of 1998 to 2000 it soared from $15 to $65 but then collapsed and gave all of that back between 2000 and 2002 as the bubble burst. It then took the stock eleven years to get back to $65, only for it to then go wild amid of rush of technology floats and fresh deposits from newly minted (multi)millionaire entrepreneurs and soar to a peak of $753 in November 2021. The 1998-2000 bubble paled into insignificance compared to the that of 2020-21 but the vibrant party has now given way to a hangover. SVB had crashed to $106 before the suspension of trading in its shares.
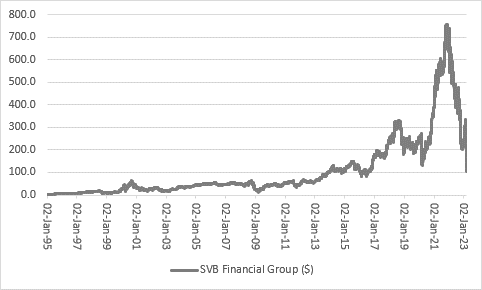
Source: Refinitiv data
“It is not just Silicon Valley Bank that shows this boom-and-bust pattern.
“There are an awful lot of ugly price charts out there, including for the rash of Initial Public Offerings (IPOs) that came to market (as benchmarked by a pair of US-listed exchange-traded funds, or ETFs); Special Purpose Acquisition Companies, set up to go and buy other, unspecified firms (where one specially-created ETF has already ceased to trade); and meme stocks, like GameStop and AMC Entertainment. The succession of failed rallies in GameStop must leave investors feeling like the cat in the Tom and Jerry cartoons as it blunders from strategically positioned garden rake to another, getting a whack in the face every time for its trouble in its pursuit of the elusive mouse.
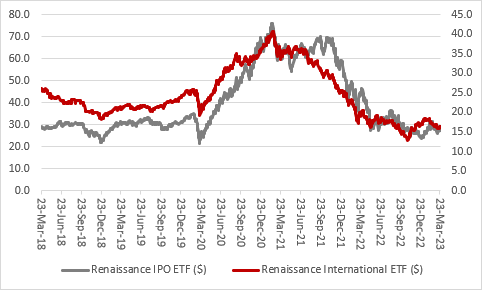
Source: Refinitiv data
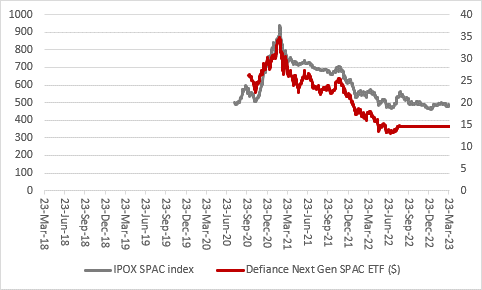
Source: Refinitiv data
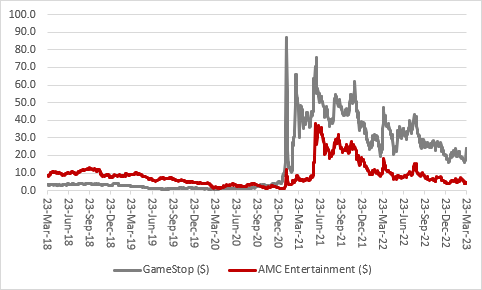
Source: Refinitiv data
“It is almost as if the last three years never happened.
“Prices that went up like a rocket have come down like the stick, back to where they were, if not lower. The tide of cheap liquidity that carried these assets higher has started to go out and, as Warren Buffett noted, ‘Only when the tide goes out do you discover who has been swimming naked.’
“These asset price drops, last autumn’s gilt market chaos and now banking shivers show it may not be easy for the central banks to extricate themselves from ZIRP and QE without something breaking somewhere. The US Federal Reserve’s balance sheet is starting to expand again, although this is because of banks tapping it for liquidity rather than a return to QE.
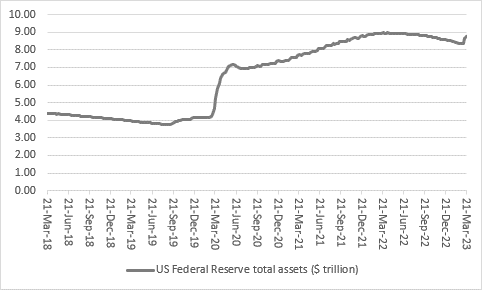
Source: Refinitiv data
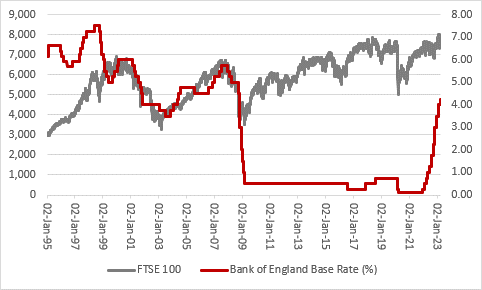
“Markets have been baying for a pause in interest rates and then a pivot to rate cuts, but in the hope of a cooling in inflation and a gentle economic slowdown, not in response to fresh financial market chaos.
“They may have to be careful what they wish for. A return to rate cuts, or even QE, at a time when inflation is still above target, might not be the positive sign that markets are seeking if the reason for the policy pivot is either a faltering economy, a blockage in the financial systems’ plumbing, or both.
“Yes, central banks responded to financial market turmoil and economic slowdowns with looser policy in 2000 and 2007. But the monetary medicine did not take effect immediately and investors were left to suffer the bear-market hangovers of 2000-2003 and 2007-2009 which followed the cheap-money, low-interest-rate-fuelled parties of 1998-2000 and 2003-2007.”
Source: Refinitiv data

Source: Refinitiv data
These articles are for information purposes only and are not a personal recommendation or advice.
Related content
- Wed, 01/05/2024 - 18:32
- Wed, 24/04/2024 - 10:37
- Thu, 18/04/2024 - 12:13
- Thu, 11/04/2024 - 15:01
- Wed, 03/04/2024 - 10:06