Archived article
Please note that tax, investment, pension and ISA rules can change and the information and any views contained in this article may now be inaccurate.
“Psychologist Abraham Maslow wrote in the 1960s that, ‘If the only tool you have is a hammer, it is tempting to treat everything as if it is a nail.’ The US Federal Reserve has spent more than a decade trying to fuel inflation with the blunt instruments of interest rates and Quantitative Easing and now it has (over)done it, the central bank seems determined to use the same tools to choke inflation, almost regardless of the damage done elsewhere. Fed chair Jay Powell seems to be focusing on inflation alone, and jettisoning prior concerns about unemployment and financial market volatility, so it is no wonder investors are getting jittery,” says AJ Bell Investment Director Russ Mould.
“Mr Powell and other leading Fed officials, notably Neel Kashkari of the Minneapolis Fed, look to be taking on board the lessons learned in the 1970s when an oil price shock, costly domestic welfare programmes, expensive overseas wars and rampant Federal spending stoked inflation and left the US central bank firmly on the back foot.
“A surge in inflation to double-digit levels in early 1974 prompted the Fed Funds rate to reach nearly 13% that summer. An easing in the rate of inflation to 5% by Christmas 1976 persuaded the Fed to back off and cut rates to 4.75%, only for the inflationary impetus to gather once more.
“Another oil price shock in 1979, after the fall of the Shah of Iran, hardly helped and US inflation peaked at 14.6% in 1980. However, under Paul Volcker, the Fed maintained its stranglehold on interest rates, and the US economy. The Fed Funds rate peaked at 19% in April 1981 and the first rate cut did not come until June 1981, more than a year after inflation peaked.
“A repeat of that timeline would leave market expectations of Fed rate cuts in 2023 looking pretty exposed and that may be one reason why investors are taking Jay Powell’s harsh words at last week’s Jackson Hole symposium so badly.
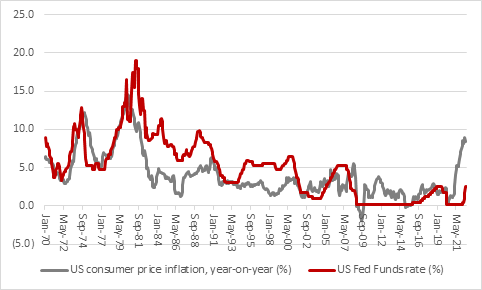
Source: FRED – St. Louis Federal Reserve
“Investors may be dismayed by bear-market falls of 20% and more in the S&P 500, Russell 2000 and NASDAQ Composite but they are trying to rally now and even those pull-backs only take the indices back to where they were in spring 2021 – way, way, way higher than the lows of 2008 (and previous peaks, for that matter) after massive thirteen-year bull run.
“This may be one reason why there are still few, if any, signs of distress in the wider US economy and financial system, at least if the Chicago Fed National Financial Conditions Index and St. Louis Fed Financial Distress indices are any guide.
“That may in turn be emboldening the Fed to think that it can keep monetary policy tighter for longer than financial markets currently expect.

Source: FRED – St. Louis Federal Reserve database

Source: FRED – St. Louis Federal Reserve database
“The Fed is, after all, behind the curve when it comes to inflation, but it now seems aware of that fact and it will not wish to repeat the experience of the 1970s when inflation did untold damage to the US economy.
“Unemployment is low and again that persuaded the Fed it can tighten further. Surging inflation means the Misery Index in the USA – the economist Arthur Okun’s aggregate of the rate of inflation and the rate of unemployment is uncomfortably high.

Source: FRED – St. Louis Federal Reserve database, Refinitiv data
“The Fed’s headline interest rate still looks very low relative to its own history and other periods when inflation drove the Misery Index up, to suggest it will have to keep hammering away at inflation, even if that inflicts pain on the jobs market and financial markets in the process.”
These articles are for information purposes only and are not a personal recommendation or advice.
Related content
- Wed, 01/05/2024 - 18:32
- Wed, 24/04/2024 - 10:37
- Thu, 18/04/2024 - 12:13
- Thu, 11/04/2024 - 15:01
- Wed, 03/04/2024 - 10:06