Archived article
Please note that tax, investment, pension and ISA rules can change and the information and any views contained in this article may now be inaccurate.
“For some, Apple’s $3 trillion price tag is the Californian company’s due reward for its innovation and ability to offer products and services which change people’s lives for the better, in terms of connectivity, productivity and entertainment,” says AJ Bell investment director Russ Mould.
“For others, it is simply another sign that stock markets are becoming bubbly and overheated ahead of what they argue will be the inevitable smash.”
“Apple’s shares began trading in December 1980 when the firm had a market cap of $1.6 billion (a figure which today would leave it nestled within the FTSE 250 index in the UK). The market cap first reached $1 trillion in August 2018, $2 trillion in August 2020 and it has just nudged the $3 trillion mark in January 2022.

Source: Refinitiv data
The bull case: the valuation is deserved (and there may be more to come)
Buyers and holders of Apple stock will argue the $3 trillion price tag is not an aberration but well deserved.
- The company is wildly profitable. In its fiscal year to September 2021, Apple generated $365 billion in sales, $109 billion in operating profit, for a margin of 29.8%, and $95 billion in after tax income. Net profit grew 65% last year to a new all-time high.

Source: Company accounts. Fiscal year to September.
- Those numbers mean return on capital employed last year was 172% to show how Apple continues to generate fantastic returns for its investors. The company’s asset-light model, where just $39 billion of fixed assets generate nearly $10 in sales for every buck of assets, shows it is scaleable. While outsourcing of production can bring its troubles, too, the services business is thriving, and this scales up in size very quickly with very little incremental investment. In the year to 2021, Apple spent just 6% of sales on research and development ($22 billion) and half that ($11 billion, or 3%) on capital investment.
- The higher-margin services operations buttress a competitive position that is already strong due to market share, brand and a technological edge by increasing customer stickiness and loyalty, through the ecosystem of apps and content. Services offered a gross margin in the last fiscal year of 69.7% compared to 35.3% to products such as iPhones, iPads and iMacs and had already grown to the point whereby they generated one fifth of sales. Bulls will also argue that Apple is only just cracking the TV and entertainment business and could yet prove a disruptive presence in other industries, including (electric) cars.
- Apple is a cash machine. It generated $99 billion in operating free cashflow in fiscal 2021. That ability to generate additional cash enabled Apple to invest in its products and services to maintain and entrench its competitive position and then supplement capital gains on its stock by returning $100 billion to investors via dividends and share buybacks. Even on a $3 trillion market cap that represents a cash yield of 3.3%, a figure that beats cash and US Government bonds (or Treasuries) hands down and, when added to the last 12 months’ 41% capital gain, more than protects investors’ money from the ravages of inflation.
- In fact, since Apple started to pay dividends and buy back stock in the fourth quarter of calendar 2012 (the first quarter of Apple’s fiscal 2012-13 year), the company has returned $662 billion in cash to shareholders. On 1 October 2012, Apple had a market cap of $618 billion, so anyone who owned the shares then would have got all of their money back and still own a stake in a wildly profitable firm. Bulls will say it takes a brave investor to bet against any firm capable of generating such copious cashflow, as its ability to keep investing in its business and rewarding investors at the same time makes it a formidable proposition.

Source: Company accounts. Fiscal year to September.
The bear case: the valuation is too high
Some of the bear case rests with issues specific to Apple, some to wider concerns over the combination of valuation, rising interest rates and the risk of galloping inflation.
- Apple is encountering regulatory pushback in several markets. The UK’s Competition and Markets Authority is looking into what it calls an Apple-Google duopoly in phone and web apps, India is now probing Apple’s 30% fee from developers on the App store, and it lost a case in the US courts brought by developer Epic, although the firm is appealing. The EU has already asserted that Apple’s employs anti-competitive tactics in the music streaming market and in the way it develops and uses its near-field communication (NFC) silicon chips and has also begun to investigate the workings of the app ecosystem and the fees that Apple charges developers.
- Competition in the smartphone and mobile device market remains fierce and is not going away. Apple’s outsourced model for silicon chips, component manufacturing and device assembly could be challenged by COVID, trade tensions between the USA and China and supply chain dislocations. The firm is now developing its own processors, rather than buying them from Intel, and this could increase costs, as could any move to onshore production closer to home. In addition, Apple is locked in another fierce fight for customer wallets in entertainment, where Netflix, Amazon, Disney and others are driving up the cost of acquired content and spending heavily on developing their own programming for good measure.
- Sceptics will also just point to the share price chart and the vertiginous gains of the past three years in particular. By the time it reached the $1 trillion market cap mark, Apple had made cumulative net profits of some $380 billion in its first 38 years as a public company. It then generated $113 billion in net profit in the next two years as it added another $1 trillion in market cap and it then took $94 billion of profit in 12 months for investors to tack on another $1 trillion in value.
- Doubters will also caution that Apple’s profits in the year to September 2021 were inflated by the effects of the pandemic, lockdowns and Government stimulus and furlough cheques. Current analysts’ consensus forecasts do at least partly acknowledge this since net profit is seen growing by just 4% from fiscal 2021 to fiscal 2024. Even if share buybacks and a lower share count mean that earnings per share (EPS) is expected to grow by 14%, to $6.39 from $5.61 by September 2024, that rate of increase hardly sets the pulse racing, at least for a stock that trades on almost 32 times forward consensus earnings. And on such a lofty rating, investors would rather see earnings growth for products and services, not financial engineering like share buybacks.

Source: Company accounts, Marketscreener, analysts' consensus forecasts. Fiscal year to September.
Those with long memories will also note how lopsided the S&P 500 index is becoming and Apple’s role within that. Meta (Facebook as was), Amazon, Apple, Netflix, Alphabet (Google’s parent) and Microsoft have between them added $2.6 trillion in market cap over the last 12 months. The S&P 500 has added $9 trillion so 29% of that gain has come from just six companies.
This sextet now represents 26% of the S&P 500’s aggregate $40 trillion market capitalisation, up from 9.6% when Meta (or Facebook as it was then) joined the market in May 2021.
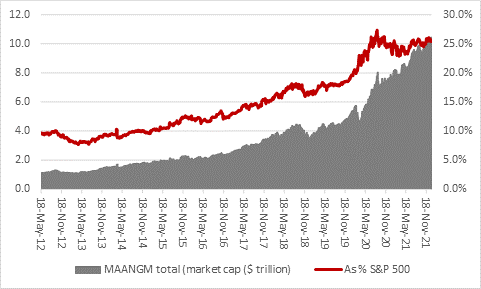
Source: Refinitiv data
Such a dash to perceived quality, reliable and safe names will prompt some investors, or at least keen students of market history, to hark back to the so-called ‘Nifty Fifty’ of the early 1970s. These supposedly unsinkable, invincible stocks were bid up aggressively by investors in the final stages of the 1970-73 bull market in US equities and they performed very well, only for the combination of lofty valuations, their ubiquity in portfolios and inflation to prompt a spectacular collapse in 1973-74. Some of the ‘Nifty Fifty’ are still around, notably Procter & Gamble, PepsiCo, Eli Lilly and Wal-Mart, but many more are either shadows of themselves, owned by other firms or simply defunct, including Polaroid, Eastman-Kodak, Xerox, Burroughs and DEC, whose technological advantages were ultimately disrupted and nullified.
These articles are for information purposes only and are not a personal recommendation or advice.
Related content
- Wed, 01/05/2024 - 18:32
- Wed, 24/04/2024 - 10:37
- Thu, 18/04/2024 - 12:13
- Thu, 11/04/2024 - 15:01
- Wed, 03/04/2024 - 10:06