Archived article
Please note that tax, investment, pension and ISA rules can change and the information and any views contained in this article may now be inaccurate.
“Pfizer’s shares are up by a third since its announcement of a covid-19 vaccine on Monday 9 November 2020 and the company upgraded its forecasts for 2021 alongside its third-quarter results on Tuesday. Anyone who held shares in the drug giant a year ago has done well but the vaccine has helped to transform the outlook for financial markets, as well as the globe’s population,” says AJ Bell Investment Director Russ Mould.
“Commodity and share prices have surged, bond prices have slumped and within stock markets many pandemic winners have become losers and many losers have become share price winners.
“In terms of asset classes, the best performer since ‘Pfizer Monday’ has not been equities but commodities. The Bloomberg Commodities index is up by 42%, easily outpacing the 26% gain in the FTSE All-World equity benchmark. Bonds have struggled. High-yield (or so-called ‘junk’) bonds have offered meagre total returns and investment-grade and sovereign, or Government, paper have served up losses.
“This picture seems to fit with the view that a recovery, and an inflationary one is coming, as investors cast aside the fear and gloom that characterised the first half of 2020, although it does not exclude the possibility that stagflation is coming our way.

Source: Refinitiv data
“Looking at the major geographic options available to stock market investors, it has been a case of America first and the rest nowhere for much of the past decade, but that picture has begun to subtly change. Since ‘Pfizer Monday,’ the US stock market has still offered a terrific total return in sterling terms of 28% but it has lagged two other arenas – Eastern Europe and the UK.
Both markets are heavily exposed to commodities, the former via index heavyweight Russia and its oil and gas companies, which in turn comprise almost half the value of the MSCI Russia equity index.
In the UK, miners and oils represent 19% of the FTSE 100’s market cap, and 43%, 52% and 44% of its forecast sales, profits and dividends respectively for 2021. After its poor relative performance, stock-market wise, on the global stage since the Brexit vote in 2016, and sterling’s post-referendum loss of value, the UK could be a value option if inflation takes hold, given its exposure to raw materials and ‘real’ assets, portfolio options which have historically offered a degree of protection to investors during previous inflationary (and stagflationary) episodes, such as those of the 1970s.

Source: Refinitiv data
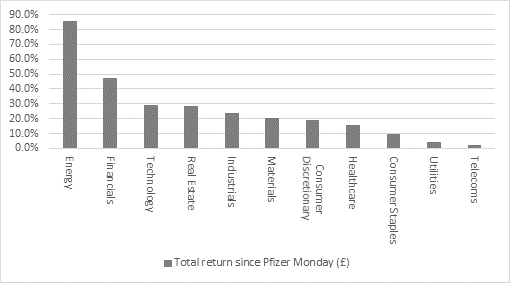
“The return to favour of Eastern Europe and the UK among investors is reflected in which equity sectors have done best since Pfizer Monday. Like the US, technology has continued to do well, offering a 29% total return in sterling terms, but also like the US it has been surpassed by two alternatives, in this case Energy and Financials.
“You would have been hard-pressed to think of two sectors that did worse during the initial stages of the pandemic, as oil prices briefly plunged into negative territory amid a collapse in demand and a glut of supply and banks began to take huge write-downs on their loan books. But the worst-case scenario did not materialise, oil prices have rallied and banks have begun to write-back some of their loan loss provisions, returning to the dividend list and in many cases launching share prices for good measure.
“If ever there was a good example of the old adage that ‘you can have good news and cheap stocks, just not both at the same time’ then this is surely it. Oils and banks (and Eastern Europe and the UK) were unloved and therefore potentially undervalued a year ago and ultimately it is the price, or valued, paid for an asset that determines investors’ returns, not how good the narrative is.
Source: Refinitiv data
“The one asset class that has fallen from favour since ‘Pfizer Monday’ is bonds. Fixed-income, in theory a haven asset, has offered little downside protection over the past year with every sub-asset class generating negative total returns, with the exception of high-yield bonds in the UK. Even this tallies with the ‘inflationary recovery’ scenario, as high-yield debt issuers tend to be in some degree of financial distress but are more likely to come out of the other side of a crisis unscathed if there is a rapid upturn in business. That means they will be less likely to fold and more likely to pay their interest on time, increasing the value of their bonds to investors.
“Otherwise, fixed-income investors have started to confront two scenarios which have barely troubled them for the past ten years, if not the past four decades – a sustained increase in inflation and a tightening of monetary policy, in the form of higher interest rates and a halt to Quantitative Easing.
“Under such circumstances the record-low, even negative, yields available on bonds on offer a year ago look far less attractive and investors have taken evasive action. The longest-dated bonds have taken the biggest hit, which makes sense as their return profiles are so much more back-end loaded and farther away in the future. This is all explained by the concept of ‘duration’:
- Macaulay duration measures the average weighted time to maturity of all coupon and principal payments
- Modified duration quantifies interest rate risk and how much a bond or portfolio of bonds will move in price relative to a 1% shift in borrowing costs.

Source: Refinitiv data
“There is no guarantee that the trends of the last 12 months will continue. It is still possible to argue that inflation, deflation or stagflation could result from the current remarkable confluence of events, with Governments and central banks’ stimulative policies, vaccinations and an end to lockdowns boosting demand on one hand, and geopolitics, Government policies such as tariffs, and dislocations in the wake of the pandemic restricting supply on the other, with ever-growing debt piles sat in the middle.
“However, it seems clear that investors still have faith in central banks’ (and Governments’) faith to navigate us through this difficult period and maintain the status quo of loose, supportive policy, modest inflation and respectable levels of economic growth.
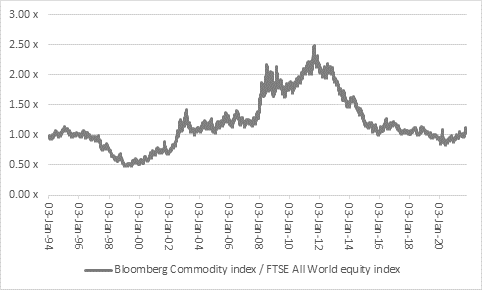
“This can be seen in two ways.
“First, the outperformance of equities relative to commodities over the past decade. Although ‘real’ assets have outperformed over past 12 months, they have not come close to making a dent in equities’ predominance. If inflation (or stagflation) do take hold, then that is not what markets are expecting or pricing in, so commodities, under that scenario could have a lot further to run.
Source: Refinitiv data
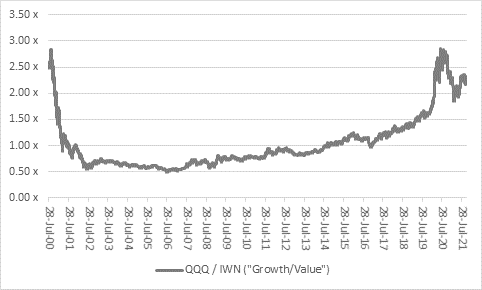
“Second, the clear outperformance of growth against value over the past decade. This makes sense in that inflation and interest rates have been low and growth hard to come by. Any company or industry capable of generating consistent earnings increases in that scenario was always going to be highly prized, and so it has proved with tech and social media and biotech stocks in particular.
“But if we get an inflationary recovery, then investors have no need to pay high valuations for jam tomorrow when they can pay much lower valuations for cyclicals and earnings growth (or jam) today, after those stocks’ underperformance of the past decade.
“The multi-trillion market caps of Facebook, Alphabet, Amazon, Apple and Microsoft continue to grab the headlines, but less highly-valued cyclicals are starting to rise more quickly, as can be seen in the last 18 months’ outperformance of the iShares Russell 2000 Value Index Exchange-Traded Fund (ticker IWN:NYSE) against the technology-and-growth laden Invesco QQQ Trust (ticker QQQ:NYSE).
Source: Refinitiv data
“If inflation really takes hold, and cyclicals and value and jam today stocks take over market leadership from long-term growth and tech and jam tomorrow stocks, there could yet be a violent change in how portfolios perform. Those investors with long memory will recall the stunning switch from growth to value that followed the peak in tech stocks in 2000 and how it took growth nearly two decades to reach the prior highs in terms of its relative performance relative to cyclicals and value.”
These articles are for information purposes only and are not a personal recommendation or advice.
Related content
- Wed, 01/05/2024 - 18:32
- Wed, 24/04/2024 - 10:37
- Thu, 18/04/2024 - 12:13
- Thu, 11/04/2024 - 15:01
- Wed, 03/04/2024 - 10:06