Archived article
Please note that tax, investment, pension and ISA rules can change and the information and any views contained in this article may now be inaccurate.
“The difference could hardly be bigger. On 2 January 2019, Apple issued a profit warning that took its shares down to an 18-month low. On 2 January 2020, the same shares reached a new all-time high, just above $300 to put a $1.3 trillion price tag on the same company. The question that investors have to ask themselves now is can Apple repeat the trick and surge again in 2020,” says Russ Mould, AJ Bell Investment Director.
“Cold mathematics would suggest that another 75% share price romp is pretty unlikely for 2020, as that would require Apple’s market cap to go up by $990 billion over the course of the year.
“It’s pretty hard to see how even the Californian giant could generate the sort of earnings growth or cash returns that could spark such an increase in market cap – but then it added nearly $600 billion in market cap in 2019, so if the Fed lets liquidity run riot and markets become positively bubbly then anything might be possible.
“But barring a full-on bubble episode, the forecast earnings growth does not look fast enough to fuel such a dramatic share price surge.
“Apple’s earnings for its financial year to September 2019 actually came in marginally down year-on-year, with earnings per share of $11.97 against $12.01 (and share buybacks and a reduced share count meant that EPS fell by less than operating profit and net profit).
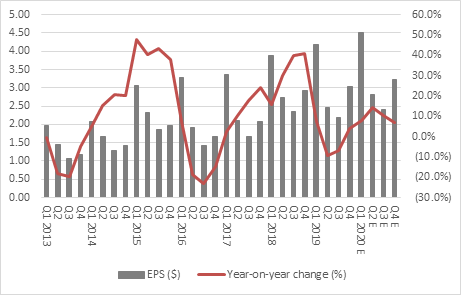
Source: Company accounts. Financial year to September.
“Add that profit drop to the share price surge and Apple stock has been hugely re-rated by investors. Granted, the consensus EPS figure rose from $11.69 in the aftermath of the January alert and the figure finally reached $11.97, but a 2% upside earnings surprise is not normally enough to drive a share price up by 75%.
| Apple: consensus earnings per share forecasts ($) | |||||
|---|---|---|---|---|---|
| 2018 | 2019 E | 2020 E | 2021 E | 2022 E | |
| Jan-19 | 12.01 | 11.69 | 13.02 | 15.23 | |
| Jan-20 | 12.01 | 11.97 | 13.07 | 15.14 | 16.36 |
| Apple: forward price/earnings ratio, based on consensus forecasts | |||||
| Jan-19 | 14.9 x | 13.4 x | 11.4 x | ||
| Jan-20 | 25.1 x | 23.0 x | 19.8 x | 18.4 x | |
Source: Company accounts. Financial year to September.
“This means investors are pricing in a lot of future growth at Apple, or at least giving it a lot of credit for reliability and quality of earnings, thanks to the flourishing ecosystem of services and app developers, which mean that customers are sticky and loyal. That loyalty thesis must view last January’s trading warning as a blip, because Apple’s shares are now trading on 23 times one-year forward earnings, up from 15 times last January.
“Yet iPhone sales have now slipped year-on-year for four quarters in a row, thanks in part to a saturated market where customers appear to be upgrading their devices more slowly, and wearables and services are not yet big enough to take up all of that slack.

Source: Company accounts. Financial year to September.
“Some $90 billion in share buybacks and dividends in 2019 may perhaps provide a firmer basis for last year’s market cap advance and such is the current strength of Apple’s cash flow the company may lavish similar returns upon investors in 2020.

Source: Company accounts
“In a low-growth, low-interest-rate, low-inflation world that could be the company’s biggest selling point, especially if it delivers the forecast earnings per share growth of 9%, 16% and 8% over the next three years. Equally, investors would need to watch out if growth or inflation were to surprise on the upside. A cyclical recovery would mean that earnings growth would be less rare and there would be less need to pay a fat multiple for it. That would leave Apple’s 23 times forward rating potentially exposed, or at least act as a cap on the upside, if value names were to become the focus of investors’ attentions.”
These articles are for information purposes only and are not a personal recommendation or advice.
Related content
- Wed, 08/05/2024 - 11:46
- Wed, 01/05/2024 - 18:32
- Wed, 24/04/2024 - 10:37
- Thu, 18/04/2024 - 12:13
- Thu, 11/04/2024 - 15:01