Archived article
Please note that tax, investment, pension and ISA rules can change and the information and any views contained in this article may now be inaccurate.

Oil prices are sliding to fresh lows for the year, despite May’s agreement in Vienna by OPEC and leading non-OPEC members (notably Russia) to stick to and extend the production cuts first announced last November by nine more months to the end of March 2018.
Oil is trading at new lows for 2017

Source: Thomson Reuters Datastream
This will be as great a source of consternation in Riyadh as it will in Moscow, given the Saudi Arabian plan to float national oil concern Aramco on a stock exchange somewhere in the world in 2018 and Russia’s reliance on crude to funds its budget and spending plans ahead of the March 2018 Presidential election.
It will also sit uneasily with many investors.
Energy is easily the worst performer out of the 11 industry benchmarks that form the S&P Global 1200 equity index, with a year-to-date loss of 10.8% in capital terms:
Energy is the worst performing global sector in the year to date
| Capital return, year to date | |
| Technology | 20.6% |
| Healthcare | 14.8% |
| Utilities | 13.1% |
| Industrials | 12.5% |
| Consumer Staples | 12.5% |
| Consumer Discretionary | 9.6% |
| Real Estate | 7.4% |
| Materials | 7.3% |
| Financials | 7.1% |
| Telecoms | 0.7% |
| Energy | -10.8% |
Source: Thomson Reuters Datastream. Based on S&P 1200 global indices
The sector has also been a dog in the UK. It’s year-to-date capital loss of 9.2% leaves it ranked 37 out of the 39 industry grouping which make up the FTSE All-Share:
Energy is the third-worst performing sector in the UK in the year to date
| Rank | Sector | Capital return, year to date |
| 1 | Personal Goods | 27.6% |
| 2 | Forestry & Paper | 24.9% |
| 3 | Electronic & Electrical Equipment | 22.0% |
| 4 | Aerospace & Defence | 19.1% |
| 5 | Household Goods | 17.3% |
| FTSE All-Share | 5.5% | |
| 35 | Technology Hardware | -7.1% |
| 36 | Industrial Metals | -7.1% |
| 37 | Oil & Gas Producers | -9.2% |
| 38 | Fixed Line Telecoms | -20.4% |
| 39 | Oil Equipment & Services | -24.3% |
Source: Thomson Reuters Datastream
This is a poor showing from a sector which represents 13% of the FTSE 100’s market cap and 13% of aggregate profits and 23% of aggregate dividend payments for that index, based on consensus forecasts.
Whether investors are looking at individual stocks or seeking to glean their UK (or global) exposure via active or passive funds, this means there are two decisions to be made:
- Do they feel oil is primed to rally or slide further?
- Do they therefore feel it is time to add or reduce exposure to energy stocks, the sector or those countries whose fortunes (and potentially stock market performance) are linked to how oil does? Norway, Russia and Brazil, as well as the Middle Eastern nations, would all like to see higher oil. Net importers like the EU, India, Japan and China will be happy to see oil go lower as it reduces their costs.
These short-term considerations must also be accompanied by analysis of longer-term trends, such as the rise of electric and driverless vehicles and what this potentially means for oil demand (cynics will argue this explains why the Saudis are preparing to sell the state golden goose that is Aramco now, as they can see which way this is going).
In a UK context these questions will also be exercising fund managers, especially those responsible for income funds.
Shell and BP are both among the five-highest yielding stocks in the FTSE 100, yet earnings cover for the dividend payment is less than one times. Both firms can cut capital investment, sell assets or raise debt to cover any near-term shortfalls, though none of these are desirable in the long-term as they could damage the companies’ long-term competitive position and thus earnings power. Investors could also see BP and Shell rely more on issuing scrip (shares) to cover the dividend, rather than cash payments, if oil remains depressed for a long time.
It is therefore interesting to note which of the 10 best performing UK income stocks currently hold one, both or none of the UK oil majors.
This positioning, and a well-researched, long-term view on oil prices, could go a long way to helping investors pick a UK equity income fund, if they feel such a collective fits with their overall investment strategy, target returns, time horizon and appetite for risk.
Top-performing UK equity income funds have scanty oil exposure
| Fund | 5-year annualised return | Yield | Ongoing charge figure | Shell in top 10 | BP in top 10 | Total energy weighting | |
| 1 | Chelverton UK Equity Income B (Inc) | 19.1% | 4.0% | 0.89% | No | No | 1.6% |
| 2 | Miton UK Multi Cap Income Institutional B (Acc) | 19.0% | 3.8% | 0.81% | No | No | 1.3% |
| 3 | Unicorn UK Income B (Inc) | 16.9% | 3.5% | 0.81% | No | No | 0.0% |
| 4 | Marlborough Multi Cap Income P (Inc) | 16.4% | 4.2% | 0.80% | No | No | 1.8% |
| 5 | Majedie UK Income X (Acc) | 16.2% | 4.3% | 0.77% | Yes | Yes | 16.4% |
| 6 | Royal London UK Equity Income M | 16.1% | 3.7% | 0.68% | Yes | Yes | 9.2% |
| 7 | Evenlode Income B (Inc) | 16.1% | 3.2% | 0.95% | No | No | 0.0% |
| 8 | Standard Life UK Equity Income Unconstrained L (Acc) | 15.3% | 3.7% | 1.15% | No | No | 2.4% |
| 9 | MFM Slater Income P (Inc) | 15.1% | 4.6% | 0.80% | Yes | No | 3.0% |
| 10 | Henderson Global Care UK Income I (Inc) | 14.9% | 3.6% | 0.84% | No | No | 0.0% |
Source: Morningstar. Where more than one
Reading the dipstick
Despite substantial swings in its price, demand for oil appears to be relatively inelastic – in other words, cheaper oil does not massively boost demand and more expensive oil does not seem to substantially hit consumption either. Demand growth seems to broadly trend alongside increases or drops in GDP.
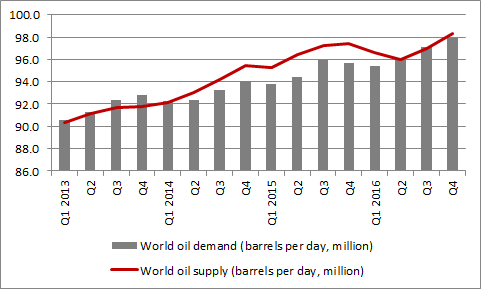
It is supply which therefore seems to determine where the price goes. According to a combination of data from the International Energy Agency and OPEC, supply is outstripping demand:
Oil supply continues to exceed demand

Source: International Energy Agency
Under the terms of the Vienna agreement, OPEC is looking to cut production by some 1.2 million barrels a day to around 32 million and non-OPEC nations by 0.6 million to around 57 million.
In addition to watching these figures investors need to keep an eye on three more important industry data-sets. The good news is they are all readily available on the internet for no cost.
1. US oil inventories. These figures are published every Wednesday.
The good news (for bulls of oil) is that US oil stockpiles (excluding the strategic petroleum reserve) have dropped from a high of 535.5 million barrels to 509.1 million barrels since March.
US oil stockpiles are still near their all-time high

Source: US Energy Information Administration
The bad is the figure is still 2% higher than a year ago, as is the combined total for raw crude and gasoline, at some 751 million barrels, and the total stands perilously close to those spring all-time highs.
America, the world’s biggest economy, is awash with crude and until these inventories are worked down it could be hard work arguing for a sustainable improvement in crude prices
2. Oil rig activity
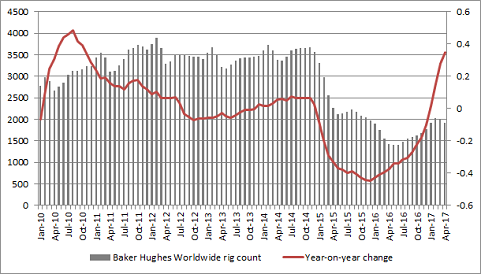
This can be measured via the Baker Hughes rig counts for America and also internationally. The former is released weekly and the latter monthly.
The bad news here (for bulls of oil) is that the count of US rigs in action has jumped 120% year-on-year, while global activity has surged by 38%.
US oil and gas drilling activity has doubled over the last year

Source: www.bakerhughes.com/rig-count
The global active oil rig count is up by more than a third relative to last year

Source: www.bakerhughes.com/rig-count
It does seem that as soon as oil pops above $50 a barrel then activity starts again.
This at least offers comfort to holders of shares in oil equipment and services firms, but that’s about all.
3. US shale output. This is what may tie together the previous two datasets.
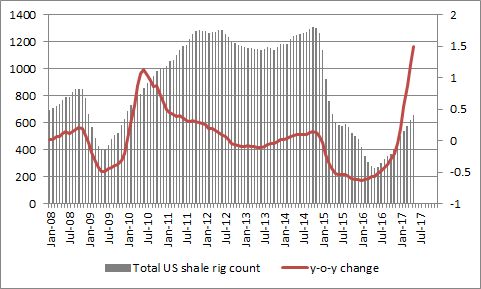
Buoyed by 2016’s recovery in the oil price from below $30 to more than $50, a lot of US shale drillers were able to refinance their debts, issue more paper or even raise fresh equity. They have therefore bounced back with a vengeance.
In June 2016, the number of US active shale rigs was just 274, down 57% year-on-year. As of May 2017 that figure had rebounded to 653.
The global active shale rig count is up by more than a third relative to last year

Source: US Energy Information Administration
Bulls of oil will say that number is barely half of the 1,309 peak seen in November 2014.
Bears will retaliate by pointing out how aggregate production of oil from America’s big shale fields (Bakken, Eagle Ford, Haynesville, Marcellus, Niobrara, Permian and Utica) is set to be 5.35 million barrels a day, only a fraction below the March 2015 record of 5.47 million.
There may be fewer rigs at work but fracking technology is clearly coming along, as the rigs are now so much more productive.
US shale production has already increased by more than 700,000 barrels a day since its autumn 2016 lows, chewing up a big chunk of the 1.8 million cut planned by OPEC and non-OPEC nations – and there could well be more to come.
US shale oil production is rising sharply once more

Source: US Energy Information Administration
Keen students of oil therefore need to watch shale oil production in the USA. Its rise is reducing OPEC and Russia’s power when it comes to controlling the oil price. A deep drop in oil may dampen production growth though what may really help Riyadh and Moscow’s cause is a deep drop in US financial markets. That would choke off the shale drillers’ access to financing via stock and bond markets and render a lot of the loss-making hydrocarbon explorers.
Think about the future(s)
The financial markets may influence oil markets in another way and anyone bravely (and probably unwisely) trying to trade oil or oil shares in the short-term needs to be aware of this.
Oil traders can go a long way to shaping near-term oil movements, to reaffirm how positioning (is everyone bullish or bearish?) and psychology (what will make them change their minds?) can dictate in the short term, even if fundamentals (supply-and-demand for commodities, cash flow and valuation for stocks) will prevail in the long term.
Oil producers and buyers will use oil futures markets to hedge their exposure but traders whose only goal is a financial gain use futures, too. Their net long (bullish) or short (bearish) positions can be tracked.
Buyers have been busily closing out their long futures positions (taken in the view oil would go up) but the number of open contracts is still 635,299 as of 14 June, compared to 231,936 short contracts.
That means the net long (bullish) exposure is 403,363 contracts.
The good news is this is way below February’s high of 556,607.
The bad news is this is way above January 2016’s low of 163,504 (reached just before oil bottomed and that probably wasn’t a coincidence).
Oil traders still look very bullish oil, using futures markets as a guide

Source: Thomson Reuters Datastream
In sum, when everyone is already bullish it can be hard for an asset to do well. It may be that the oil market needs to see more buyers turn sellers and the net open futures contracts position shrink further
Conclusion
Given the number of moving parts, investors clearly need to approach oil and oil-related stocks with some caution. If OPEC cannot predict what is going to happen, then investors need to be realistic about how effective their own crystal balls may be.
For the oil price to hold firm, and make renewed gains, it would be helpful to see US inventories go down, the rebound in drilling work slow and even the financial markets to wobble and choke off the shale drillers’ access to fresh capital.
Other than that, OPEC and Russia will need to reassess their strategy once more, come the next scheduled summit in Vienna this coming November, and investors will have to keep on top of developments, given the importance of oil and oil stocks to many countries as well as specific companies.
Russ Mould, AJ Bell Investment Director
Related content
- Thu, 09/05/2024 - 08:44
- Mon, 29/04/2024 - 09:30
- Wed, 17/04/2024 - 09:52
- Tue, 30/01/2024 - 15:38

