xxxxx VOL 25 / ISSUE 03 / 26 JANUARY 2023 / £4.49 Why now could be a good time to invest in real estate stocks PROPERTY BARGAINS INVEST FOR LESS How tracker funds can make your life easier

FOR MORE INFORMATION ON PREMIUM SEATING PACKAGES, VISIT: LORDS.ORG/ASHESPREMIUM OR CALL: 020 7616 8726 •LIMITED OPTIONS AVAILABLE •BREATH-TAKING VIEWS & WORLD-CLASS DINING •EXCLUSIVE ACCESS-ONLY AREAS PREMIUM SEATING AVAILABLE GUARANTEE YOUR SEAT FOR THE MEN’S ASHES AT LORD’S
•
•
•
•


26 January 2023 | SHARES | 03 Contents 06 NEWS
Activist investors give big boost to Salesforce and Restaurant Group
Could Procter & Gamble’s latest update spell trouble for its UK rivals?
Expert predicts further bad news for popular investment trust Scottish Mortgage
How Saga shares have more than doubled in three months
rates
12 GREAT IDEAS New: PepsiCo / Henderson Far East Income Updates: Spirent 16 ETFs Invest for less: How tracker funds can make your life easier 23 ETFs The quick and easy way to build a diversified portfolio using cheap tracker funds 26 ETFs Foreign currency ETFs explained and how exchange rates affect performance 30 FEATURE Why real estate stocks could be a good bet for the medium term 36 EDITOR’S VIEW The real catalyst for the FTSE 100 to hit a new record high 37 RUSS MOULD Which are the most and least popular stocks heading into 2023? 43 FEATURE Why InterContinental Hotels is turning investor heads 48 FEATURE Why a £100,000 limit on ISAs is a bad idea 50 EMERGING MARKETS Why emerging markets could be on the cusp of a green revolution 52 ASK TOM What is ‘pound-cost ravaging’ and how does it affect my pension? 53 PERSONAL FINANCE Premium Bonds prize fund has risen – but are they worth it? 56 INDEX Shares, funds, ETFs and investment trusts in this issue 30 43 52 16 12 06
• Higher
and big earnings downgrades put Ascential in the doldrums
Three important things in this week’s magazine
Whyrealestate stocks
Feature:Realestatestocks
Tnotmarket,whynotsimplymirrorwhatitdoesand worryaboutafundmanagermakinggoodor trackerbaddecisions.Exchange-tradedfundsorETFsareaformof fund.Theirchargesaretypicallyalot lowerthananactivelymanagedfundbecause thereisnofundmanagertopay.Instead,theETFs rulestrackaspecificindexwhosemake-upisbasedon thatacomputercanmanageatlittlecost. inThismightbeabasketoflargesharestrading generousacertainpartoftheworldoroneswhichpay dividends. product.TheappealofETFscanbeillustratedbyasingle comparedForanongoingchargeofjust0.05%, witharoughaverageofaround1%foractivelymanagedfunds,investorscanuseAmundi
PrimeGlobalETF(PRIW)togainexposuretomore than1,500stocksacrossdevelopedmarkets.This exampleofdiversificationatsuchalowcostis what’sdrivengrowthintheETFmarketsincethe firstsuchinstrument,trackingtheFTSE100index ofUKshares,waslistedinLondonin2000. expandedIntheintervening20-plusyearsthemarkethas hugely,andinvestorscannowinvestina widevarietyofmarketsusingETFsincludingbonds, property,commoditiesandevenspecificthemes andinvestmentstyles. Inthisarticlewelookatthedifferentoptions andhighlightsomeofthecheapestproducts.Ina separatearticle,weselectsomeETFstocreatea diversifiedportfoliofromscratch.

This week’s main feature looks at the cheapest ways to invest in markets, themes and more via ETFs. There’s something for everyone and it’s easy to build a diversified portfolio with just a handful of products.
heseveretighteninginfinancial conditionsinthesecondhalfof2022 atcausedcommercialpropertyvaluestofall thefastestsix-monthrateonrecord. areAsaresultofmuchcheapervaluations,investors timeaskingthemselveswhethernowisagood companiestostarttakingpositionsinlistedproperty andrealestateinvestmenttrusts,alsoknownasREITs. couldWelookatwherevaluationsare,wherethey go,andwhichstockslookthemostattractive.WHATHASHAPPENEDTOVALUATIONS? Onekeythingretailinvestorsneedtoappreciate aboutpropertycompaniesistheimportanceof interestratesindeterminingvaluations. changesPropertyisanincome-generatingasset,and investorsininterestratesaffecttherateofreturn requireontheirinvestment. bankBeforeMarch2020,theBankofEngland’sofficial 0.75%,rate(alsoknownasthe‘baserate’)was butwithinweeksoftheCovidcrisisthe bankcutitsratefirstto0.25%andthento0.1%,a 325-yearlow.Asaresult,theyieldonUKgovernmentbonds orgilts–consideredthe‘risk-free’rate–slumped, allowingrentalyieldsonpropertytofalland valuationstosoar. retailThebest-performingpropertyassetswere householdswarehousesandprimelogisticscentresas shiftedtoshoppingonline. BankWiththepandemicintherear-viewmirror,the 2021,ofEnglandbeganraisingratesinDecember sincewhenithashikedthebaseratenine timesto3.5%,meaninghigheryieldsongiltsand propertystocks. Justaslowerratessparkedajumpinvaluations,

withsohigherrateshaveseenvaluationsfallsharply, theworst-affectedsectorsbeinglogistics and‘big-box’retailwhichpreviouslygainedthe most. expertAccordingtocommercialpropertyvaluation CBRE,whichcompilesanindexbasedon andthevalueofover1,000commercialproperties 31monthly-valuedfundsworthintotalover 2022.£16billion,overallcapitalvaluesfellby13.3%in bounce-backThatcompareswitha13.8%post-pandemic in2021. declineIndustrialassetsfell21%invalue,followedbya of12.1%inofficesand8.1%inretail. strongestOnapositivenote,rentalvaluesrose4.7%,the sincethemillennium,withindustrial forrentsup10.3%,officesup2%anda0.5%increase Asretail. -18.1%aresult,thetotalreturnforeachsectorwas forindustrialassets,-8.2%foroffices,and for-2.1%forretail,withtheoveralltotalreturn-9.1% theyear. ISTHEREMOREDOWNSIDETOCOME? Theconsensusviewisthatcommercialproperty morevaluationswillkeepfallingthisyeardueto interestraterises,aUKeconomywhich isweakeningifnotalreadyinrecessionand continuingmacro-economicuncertaintyduetothe ongoingconflictinUkraine. theTherearestillvaluationconcernsoverpartsof retailsectorexposedtothecost-of-livingcrisis
Discover the reasons why experts are turning more bullish on the space and the stocks that look attractive.
3
Werevealthenameswiththemost amountof‘buy’or‘sell’ratings

Everyyearthiscolumntrackstheratings FTSEputonstocksacrosstheFTSE100and provide350bytheinvestmentbankswhich researchontheUKequitymarket.bullishThistime,theanalystcommunityisthemost ithaseverbeensinceourfirstsurvey backin2015,basedonstock-specific,public recommendations. ‘buys’Asweenter2023,57%ofallstockratingsare andjust9%are‘sells’forconstituentsofthe FTSE100,thejoint-highestandjoint-lowestscores
AnalystsaremorebullishthaneveronFTSE100andFTSE250stocksasweenter2023


overthepastnineyearsrespectivelyandmatching thoseof2022.FortheFTSE350index63%ofall recommendationsarepositiveratingsandjust8% wenegativeones,thehighestandjoint-lowestsince beganthissurveyin2015.Sharesisnotendorsingtheseviews,butinvestorsacouldbeforgivenforwonderingwhetherthisis warningsignaltobuymoreLondon-tradedstocksora MomentumtocutexposuretoUKequities.playersmayfeelinclinedtogo withthepositiveflow.Contrariansmaytakethe
Source:Refinitivdata,analystsconsensus,Marketscreener.Dataasof6January2023
Source:Refinitivdata,analystsconsensus,Marketscreener.Dataasof6January2023
Take more notice of broker ‘sell’ ratings than ones that say ‘buy’.
Table:Sharesmagazine•Source:Refinitivdata,analystsconsensus, Marketscreener.Dataasof6January2023
Going against the crowd takes more conviction and therefore ‘sell’ ratings are worth analysing, particularly when most brokers are bullish on a stock.

Sosandar shares strut 10% higher as Sainsbury’s clothing tie-up excites


1 18 SHARES |26January2023
TomSieberDeputyEditor INVEST FOR HowLESS tracker funds can make your life easier 04 | SHARES | 26 January 2023 Contents Visit our website for more articles Did you know that we publish daily news stories on our website as bonus content? These articles do not appear in the magazine so make sure you keep abreast of market activities by visiting our website on a regular basis. Over the past week we’ve written a variety of news stories online that do not appear in this magazine, including:
2
26January2023 | SHARES 29
26January2023 SHARES 35
Tcould be a goodbetforthe mediumterm Expertsandanalystsseevaluations bottomingoutthisyear
Insightfulcommentaryonmarketissues RussMould
AJBell
InvestmentDirector
Whicharethe most and least popularstocks headinginto2023?
FTSE 100 2015 47%39%14%
2017
Buys Holds Sells
2016 47%40%13%
45%40%15% 2018 49%37%14% 2019 52%36%12% 2020 46%38%16% 2021 54%35%14% 2022 57%33%9% 2023 57%34%9% Average2015-2023 51% 37% 13%
Table:Sharesmagazine
FTSE 250 2015
Buys Holds Sells
52%38%10% 2016 49%40%11% 2017 48%38%14% 2018 48%40%13% 2019 50%40%10% 2020 48%40%12% 2021 55%35%10% 2022 62%31%8% 2023 63%29%8% Average2015-2023 53% 37% 11%
Buys Holds Sells
FTSE 250 2015 52%38%10% 2016 49%40%11% 2017 48%38%14% 2018 48%40%13% 2019 50%40%10% 2020 48%40%12% 2021 55%35%10% 2022 62%31%8% 2023 63%29%8% Average2015-2023 53% 37% 11%
Table:Sharesmagazine
250
53% 37% 11% Buys Holds Sells
FTSE
2015 52%38%10% 2016 49%40%11% 2017 48%38%14% 2018 48%40%13% 2019 50%40%10% 2020 48%40%12% 2021 55%35%10% 2022 62%31%8% 2023 63%29%8% Average2015-2023
Table:Sharesmagazine Source:Refinitivdata,analystsconsensus, Marketscreener.Data of January2023
More to go in airlines’ recovery says Liberum, EasyJet shares most attractive
Marston’s shares gain 8% as investors cheer strong Christmas trading
Why 13% dividend hike puts spotlight on Greencoat UK Wind’s dividend appeal
You can save a lot of money on charges by investing in tracker funds.
Now might be a good time to look for opportunities in the commercial property space.
A unique investment philosophy
Finding value overlooked or misunderstood by the market
Asset Value Investors (AVI) has managed the c.£1.1bn* AVI Global Trust (the “Trust”) since 1985. The strategy over that period has been to buy quality companies held through unconventional structures and trading at a discount to estimated underlying net asset value; the strategy is global in scope, and we believe that attractive risk-adjusted returns can be earned through detailed research with a long-term mind-set.
The companies we invest in include family-controlled holding companies, closed-end funds, other asset-backed special situations and, most recently, cash-rich Japanese companies. The approach is benchmark-agnostic, with no preference for a particular geography or sector.
AVI has a well-defined, robust investment philosophy in place to guide investment decisions. An emphasis is placed on three key factors: (1) companies with attractive assets, where there is potential for growth in value over
time; (2) a sum-of-the-parts discount to a fair net asset value (“NAV”); and (3) an identifiable catalyst for value realisation. A concentrated core portfolio, with the current top 10 holdings accounting for nearly 60% of NAV, allows for detailed, in-depth research which forms the cornerstone of our active approach.

Once an investment has been made, we seek to establish a good relationship and actively engage with the managers, board directors and, often, families behind the company. Our aim is to be a constructive, stable partner and to bring our expertise – garnered over three decades of investing in asset-backed companies–for the benefit of all.
AGT’s long-term track record bears witness to the success of this approach, with a NAV total return well in excess of its benchmark. We believe that this strategy remains as appealing as ever and we continue to find plenty of exciting opportunities in which to deploy the Trust’s capital. Past performance should not be seen as an indication of future performance. The value of your investment may go down as well as up and you may not get back the full amount invested. Issued by Asset Value Investors Ltd who are authorised and regulated by the Financial Conduct Authority.
*As at 31 October 2022
AVI-Global-Trust AVIGlobalTrust @AVIGlobalTrust
Discover AGT at aviglobal.co.uk
Activist investors give big boost to Salesforce and Restaurant Group
It’s been a rough period for shareholders of software provider Salesforce (CRM:NASDAQ) with the shares halving since November 2021.
Some relief came on 23 January after the Wall Street Journal reported activist investor Elliott Management had taken a multi-billion-dollar stake. The shares gained more than 2% adding to the 14% gains already notched-up in 2023.
Managing partner Jesse Cohn told Reuters ‘We look forward to working constructively with Salesforce to realise the value befitting a company of its stature.’
an investor presentation the investor said it was pleased with the $50 billion 2026 sales target but was disappointed by the 42% operating margin target, considering a peer group average of 50%.
Like many technology companies which overexpanded during the pandemic Salesforce announced this month it was laying off around 10% of its workforce and closing some offices.

Elsewhere, hedge fund and activist investor Oasis Management has taken a 5% stake in Wagamama and Frankie & Benny chain owner Restaurant Group (RTN) according to a Financial Times report (20 January). The stake was purchased in November 2022.
The Hong Kong-based investor last hit the headlines in the UK after building a near 20% stake in Mr. Kipling cake maker Premier Foods (PFD) and campaigning to oust its CEO.
Elliott targets companies it believes have good fundamentals and prospects but where management have ‘dropped the ball’ causing the company to fall short on delivering its full potential.
The activist took a stake in pharmaceutical firm GSK (GSK) in April 2021. It pushed for management change and supported the demerger of consumer healthcare division Haleon (HLN) which was listed on the stock market in July 2022.
In the case of Salesforce Cohn said the company was ‘one of the preeminent software companies in the world’.
Elliott is the second activist investor to target Salesforce in the past year. In October 2022 Starboard Value announced a ‘significant’ stake. In
Hospitality was one of the worst-hit sectors during the pandemic while the cost-of-living crisis has hampered Restaurant Group’s recovery. Rising interest rates have also provided a challenge.
Restaurant Group extended its borrowing facilities in December by two additional years out to April 2028 and has agreed extra headroom with lenders to operate with a higher debt to EBITDA (earnings before interest, tax, depreciation, and amortisation) ratio.
In addition, the company has capped its interest costs to reduce the risk of interest changes over the next four years. The revised debt package means the firm had upwards of £140 million of cash headroom as at 21 December. [MG]
06 | SHARES | 26 January 2023 News
A ray of hope for anyone holding underperforming shares is the arrival of a shareholder who will shake things up
Salesforce ($) 2021 2022 2023 100 200 300 Chart: Shares magazine • Source: Refinitiv
Could Procter & Gamble’s latest update spell trouble for its UK rivals?
There is an important read-across to Unilever and Reckitt which will soon update the market
USconsumer health and hygiene giant Procter & Gamble (PG:NYSE) delivered what initially looked like a positive set of second quarter results, beating revenue estimates and increasing its full year organic growth forecast.

However, P&G shares fell to two-month lows as investors were spooked by falling sales volumes and a continued rise in input costs.
Despite meeting Wall Street estimates with earnings per share of $1.59 and slightly beating sales forecasts, the firm revealed a 6% drop in second-quarter volumes driven by falling consumption and a big hit to margins from increased raw material costs and a negative product mix.
The firm also said given ‘continued significant cost headwinds from commodity and materials costs’ and foreign exchange impacts, it expected earnings per share to be towards the lower end of its guidance range for the current year.
The question investors will be asking is whether UK firms such as Unilever (ULVR) and Reckitt (RKT) can avoid the same pitfalls when they report in a couple of weeks’ time, and even if their results are good will the shares respond positively?
In October, Unilever posted a forecast-beating 10.3% increase in third-quarter sales due to record price increases and raised its full-year revenue growth guidance to ‘above 8%’, so that is the first figure investors will scrutinise when the firm reports its annual results on 9 February.
Price hikes came at the expense of unit sales, which declined 1.6% in the quarter, and the company braced the market to expect ‘more negative underlying volume growth’ in the final three months of the year.
Chief executive Alan Jope also maintained his target of a 16% operating margin and guided investors to expect the return on sales to rise further this year due to strong pricing, an improved product mix and cost savings, so the margin outlook will be just as important as the results.
Reckitt also delivered better than expected third quarter sales and predicted full year revenue growth would be at the top end of its 6% to 8% range of guidance.
Price and product mix improvements of 12% came at the expense of a 4.7% decline in volumes and meant overall revenue growth slowed sharply from the second quarter, although the continuing strength of the US dollar provided a further tailwind to sales when reported in sterling.
When Reckitt reports on 17 February, as well as the top line investors will be looking to see how much further costs have risen as the firm has repeatedly cautioned higher input prices will affect its profit margins. [IC]
26 January 2023 | SHARES | 07 News
Procter & Gamble ($) 201820192020202120222023 0 50 100 150 Chart: Shares magazine • Source: Refinitiv
Expert predicts further bad news for popular investment trust Scottish Mortgage
Shares in Scottish Mortgage Investment Trust (SMT) are down by one third in value over the past 12 months at 746.6p, having sold off due to the impact of high inflation and rising interest rates on long duration assets including the ‘world’s most exceptional growth companies’ it invests in.
Scottish Mortgage became an investor favourite after delivering a staggering net asset value (NAV) total return of 2,921% between November 2008 and November 2021. But the Baillie Gifford-run trust is now the second worst one-year share price total return performer in the Association of Investment Companies’ Global sector with souring sentiment reflected in a near-12% share price discount to NAV.
at the highest level for a decade. It points out private investment exposure is at full capacity, with the trust currently unable to make follow-on or new investments in this part of the market.
Investec is also concerned the reduction in private company valuations ‘may gather momentum as audited year-end numbers begin to feed through for those funds where there is a valuation lag’, a major risk given that private companies speak for 35.9% of portfolio NAV.
And with central banks struggling to control inflation, the global economy is at risk of tipping into recession with an acceleration in quantitative tightening set to further drain liquidity.
Scottish Mortgage 500
1,500 Chart: Shares magazine • Source: Refinitiv
‘Over the next few months, this environment could bring further strong headwinds for Scottish Mortgage’s “growth at unreasonable prices” philosophy, with the manager favouring stocks with growth of an explosive nature,’ says Investec.
1,000
Investec Securities has urged clients to ‘sell’ Scottish Mortgage in a research note (19 January 2023), warning the next few months may bring ‘the second leg’ of the sell-off in riskier growth assets. That would be bad news for Scottish Mortgage, whose holdings include gene-sequencer Illumina (ILMN:NASDAQ) and Elon Musk-led Tesla (TSLA:NASDAQ) and SpaceX, the latter privately owned.

Investec worries Scottish Mortgage’s balance sheet is overstretched, with gearing of 17%
Despite such headwinds, Scottish Mortgage’s optimistic managers Tom Slater and Lawrence Burns remain focused on the long-term and are sticking to the trust’s key interests – digitisation of society, the intersection of biology and technology, and the energy transition.
Meanwhile, investment bank Stifel argues the ‘cliff-edge’ in NAVs implied by wide discounts among private equity trusts may be avoided. When the market sees beyond the peak in interest rates, it believes there could be increased buying interest and a sharp rebound in the valuations of funds investing in private equity and mid/small caps.
08 | SHARES | 26 January 2023 News
There are reasons to expect further pain in the coming months
Also offering some optimism is Wedbush Securities’ Dan Ives, who predicts technology stocks in general will surge about 20% this year, with layoffs across the sector marking ‘the first major step’ toward stabilising this crop of recently struggling stocks. [JC] (p) 201820192020202120222023
How Saga shares have more than doubled in three months HIGHER Moving
Over-50s travel and insurance group Saga (SAGA) has rebounded strongly of late, gaining 120% in just three months.
This increase in the share price is from all-time lows below 100p and the shares are still, once you adjust for a 2020 share consolidation, down more than 90% on the price at which they listed in 2014. This isn’t really a recovery of Saga’s own making and has been
led by wider positivity towards the travel space. The company, often the author of its own misfortune, did post a relatively reassuring update on 24 January, though a 10-fold increase in revenue for its travel and cruises business is still expected to translate into a small loss in the 12 months to 31 January. The insurance underwriting division is also set to be loss-making.
Thungela loses its crown as coal prices fall back
Having been one of the best performing shares in 2022, South African coal miner Thungela Resources (TGA) has now lost momentum.
The stock has fallen by nearly 40% in value over the past four months as coal prices have weakened as weather conditions in parts of Europe have been milder than expected, thus hurting demand.
Analysts at Liberum say the stock is ‘cheap’ under all likely scenarios, despite weaker coal prices and problems with South Africa’s
rail network which is impacting deliveries to a major port. Its base case is 15 million tonnes of coal sales in 2023 at the $170 per tonne price at which you can buy coal in the market today.
If achieved, it expects Thungela to pay out dividends equal to a 28% yield. Should the miner only sell 10 million tonnes of coal – Liberum’s bear case – at $120 per tonne, the analysts still believe shareholders would get an 8% yield.
Clearly the risk of a further decline in the coal price could pull down the shares even more, so

Saga is considering a sale of the underwriting business with the proceeds used to pay down borrowings. While this could boost sentiment, it might not make too much of an impression in its £721.3 million net debt pile given a large portion of the underwriting function for its insurance business had been outsourced. [TS]
Saga (p)
in the dumps
investors must consider capital gains and losses in addition to the potential income. [DC]
Thungela Resources (p)
26 January 2023 | SHARES | 09 News
Over-50s travel and insurance firm has recovered from record lows
The miner has gone from stock market winner to loser
Apr 2022 JulOctJan 2023 0 50 100 150 200 250 300
•
Chart: Shares magazine
Source: Refinitiv
Apr 2022 JulOctJan 2023 400 600 800 1,000 1,200 1,400 1,600 1,800 Chart: Shares
• Source:
magazine
Refinitiv
DOWN
UK UPDATES OVER THE NEXT 7 DAYS
FULL-YEAR RESULTS
30 January: SThree 1 February: Glencore, GSK 2 February: Shell
HALF-YEAR RESULTS
31 January: ITM Power, NWF 2 February: Renishaw
TRADING UPDATES
27 January: Industrials REIT, Paragon Banking 30 January: DP Eurasia, Computacenter 31 January: Hochschild Mining, Pets at Home 1 February: Entain, Gem Diamonds, Vodafone
2 February: Airtel Africa, BT, Cranswick, JTC
Questions for BT
THE TELECOMS GROUP NEEDS TO START PROVIDING SOME ANSWERS IF IT IS TO KEEP SHAREHOLDERS ON SIDE
Telecoms group BT (BT.A) has a mountain to climb if it is going to keep shareholders satisfied with its third quarter update on 2 February and its promised price hike.
The firm’s Q2 results raised more questions than they answered,
Shell time
HIGHER GAS PRICES A BOON BUT WINDFALL TAXES MAY BITE
Energy giant Shell (SHEL) has already published a raft of forecasts for production and costs across its business ahead of its fourth quarter results on 2 February, which suggest a decent lift to earnings from its LNG (liquefied natural gas)
according to analysts at Berenberg, such as whether the growth in average revenue per consumer customer is sustainable, has weakness in the Enterprise business bottomed and does the decline in Openreach’s broadband base represent ‘a new normal’?
As well as providers answers to these questions, the company needs to assure the market it will stick with a plan to raise prices in March by 14% or CPI plus 3.9%, as permitted by the regulator, in the face of an all-too-likely political storm. [IC]

division while lower oil prices will impact refined products.

It has indicated windfall taxes in the UK and Europe could be as much
as $2 billion, which will no doubt feature in any commentary on its previously communicated plan to invest £25 billion in the UK. [IC]
10 | SHARES | 26 January 2023
News: Week Ahead
All eyes on Amazon
FOURTH QUARTER EARNINGS EXPECTATIONS WERE SIGNIFICANTLY DOWNGRADED LAST OCTOBER
Investors will be keen to see if e-commerce giant Amazon (AMZN:NASDAQ) lowered expectations enough after significantly downgrading its fourth quarter earnings outlook in October. The results will be published on 2 February.

Revenues are expected to be between $140 billion to $148 billion with operating income ranging from zero to $4 billion.

Consensus full year earnings
estimates have tumbled from a profit of $1.34 billion to a loss of around $1.2 billion according to Refinitiv data. Earnings for 2023 are forecast to bounce back to almost $17 billion. Amazon has been forced to retrench following overexpansion during the pandemic which saw its workforce more than double to 1.6 million. In January the company announced 18,000 job cuts and a hiring freeze as it prioritises cost control and profitability. [MG]
US UPDATES OVER THE NEXT 7 DAYS
QUARTERLY RESULTS
27 January: American Express, Chevron 30 January: NXP
31 January: Exxon Mobil, Pfizer, McDonald’s, United Parcel Service, Caterpillar, AMD, Stryker, Mondelez, Marathon Petroleum, General Motors, Phillips 66, MSCI, Spotify 1 February: Meta Platforms, Novo Nordisk, Alibaba, Novartis, Altria, Vertex, Boston Scientific 2 February: Apple, Alphabet, Amazon, Eli Lilly, Merck & Co, Roche, Bristol-Myers Squibb, Conoco Phillips, Starbucks
Why advertising revenue will be in focus when Meta reports
WHY MARK ZUCKERBERG’S UNLOVED META MUST START TO DELIVER
Meta Platforms’ (META:NASDAQ) fourth quarter results update on 1 February will be scrutinised by investors to see if the company achieved guidance for quarterly revenue in the $30 billion to $32.5 billion range. That will depend on whether weaker advertising spend has impacted its Facebook and Instagram social
media platform earnings.
Revenue softened 4% year-on-year to $27.2 billion in the third quarter of 2022 and Meta is coming under increased investor scepticism surrounding its metaverse strategy, as well as concerns over governance and privacy regulation. [JC]
26 January 2023 | SHARES | 11 FEATURE FEATURE News: Week Ahead
Why
Arecent rising market tide has lifted all boats, with shares in many cyclicals and lower-quality businesses moving higher. But given the difficult year shaping up for the global economy, high-quality, cash-generative companies with defensive characteristics are the best stocks to own for the duration of 2023 and beyond.
A perfect example of this is soft drinks-tosnacks giant PepsiCo (PEP:NASDAQ). This US multinational boasts brand strength, pricing power and a track record of beating earnings forecasts then raising guidance.
Despite an impressive long-run share price chart moving up and to the right over many years, PepsiCo has recently dipped to create a good entry point. It is a terrific total return stock, having raised the dividend for 50 consecutive years and with the company now buying back up to $10 billion worth of stock over the next three years.
Guided by CEO Ramon Laguarta, PepsiCo’s portfolio of super-resilient brands spans everything from eponymous soft drink Pepsi to Gatorade, Mountain Dew, Frito-Lay, Quaker Oats, Walkers and Tropicana. Copious cash generation enables PepsiCo to sustain investment in brand innovation and marketing to extend market share gains.
High inflation continues to squeeze consumer spending around the globe, yet PepsiCo has been able to flex its pricing power muscles and pass elevated raw material costs onto shoppers without denting demand. Treats such as fizzy drinks or crisps are affordable repeat purchases which can get consumers through the stresses of everyday life.
And brand loyalty is strong in this area; even if prices go up, people are less likely to turn to supermarket own-brand products or other cheaper alternatives when the craving for a PepsiCo product strikes.
PepsiCo has protected profitability by raising prices successfully and there is now scope for margins to expand as commodity input costs go down.

Following strong third quarter results (12 October 2022) showing organic sales growth of 16%, PepsiCo raised its year-to-December 2022 organic revenue growth guidance from 10% to 12% and its constant currency earnings per share growth forecast from 8% to 10%. Fourth quarter and full year results will be published on 9 February.
According to Stockopedia, you’ll have to pay up for PepsiCo’s defensive earnings and cash flows as the stock trades on a 12-month forecast rolling price to earnings ratio of 23.3. However, this rating is a discount to a high of 31.9 times scaled in 2021 and PepsiCo also offers a 2.8% dividend yield. It is also worth noting that investors who’ve previously bought PepsiCo ‘on the dip’ over the years have been richly rewarded as the stock has subsequently continued on its upwards trajectory. [JC]
12 | SHARES | 26 January 2023 Great
Ideas: Investments to make today
you can be confident in soft drinks and snacks giant PepsiCo The Pepsi-to-Walkers crisps wonder should prove resilient as it continues to serve up strong growth PEPSICO BUY (PEP:NASDAQ) Price: $169.88 Market cap: $234.1 billion PepsiCo ($) 201820192020202120222023 100 120 140 160 180 Chart: Shares magazine • Source: Refinitiv
Income seekers should snap up the 8% yield at this Asia-focused trust
for the rest of the world over the past five years, meaning there is ‘plenty of wiggle-room to grow’ says Kerley.
HENDERSON FAR EAST INCOME (HFEL)
Investors looking to build a diversified portfolio with an emphasis on income ought to look at Henderson Far East Income (HFEL), an investment trust which is currently yielding more than 8% and has raised its dividend annually for the last 15 years.
While Asia may not occur straight away as a predictable source of cash flows and income, profits and dividends have been growing strongly and the region is expected to grow faster than the rest of the world this year.

In the past few months, the trust has reduced its exposure to Taiwanese technology stocks, after weak results in the sector pointed to an oversupply of chips and falling margins. It has added a Chinese consumer goods company and a copper miner, which was neatly timed given the strong run in the copper price of late.
The trust currently has close to a one-third weighting in financial stocks, which pay good dividends and are benefiting from rising interest rates, followed by a 14% weighting in telecoms, a 13% weighting in real estate and an 11% weighting in energy.
Asia is hugely diverse with hundreds of strong dividendpaying companies to choose from”
Structural reforms put in place since the crisis in the late 1990s mean Asian economies and companies are on a much better footing than in the past with stronger balance sheets and low levels of unhedged foreign debt.
Combined with high margins and positive economic growth, the dividend growth story has become an intriguing one for investors, according to manager Mike Kerley.
‘Asia is hugely diverse with hundreds of strong dividend-paying companies to choose from. Given they tend to be under-researched relative to other stock markets, it presents hidden gems for actively managed trusts such as Henderson Far East Income to find,’ he says.
Dividends in Asia are expected to rise by 8% to a record £333 billion in 2023, yet companies are still quite conservative in their financial management with pay-out ratios (the percentage of net income paid in dividends) averaging just 39% versus 47%
Unusually for a Far East-focused trust, China isn’t the key focus: on a country basis, just over one-fifth of the portfolio is invested in South Korea and a similar amount in Australia, with China accounting for less than one-fifth of assets.
The trust has a 1.01% ongoing charge, trades at a small premium to net asset value and has recently broken out of a multi-year downward trend which suggests investors should look sooner rather than later. [IC] Henderson Far East Income (p)
26 January 2023 | SHARES | 13
Great Ideas: Investments to make today
201820192020202120222023 250 300 350 Chart: Shares magazine • Source: Refinitiv
Far East Income invests in companies with sustainable and rising pay-outs
Henderson
Net assets:
Price: 288p
£416 million
Our big reason for investing in Spirent is gone so best to walk away
We flagged the appeal of telecoms testing firm Spirent (SPT) at 275p on 12 January, seeing it as a smart way to play the rollout of 5G mobile network infrastructure. Sadly, a 20 January trading update materially undermined this hypothesis.

WHAT’S HAPPENED SINCE WE SAID TO BUY?
Spirent provides testing, analytics and security services to the telecommunications space and it was a warning of hesitancy on the part of this customer base which really rocked sentiment towards the company and saw the shares drop more than 20% at one point, falling way below our entry point.
The Crawley-based business at least confirmed guidance for 2022 – with profit slightly ahead of the market consensus of $127 million – a 7.2% year-on-year increase. The order book was also up 7% in the year. However, delays are now expected to see a ‘heavier than usual’ second-half
weighting for 2023. Broker Canaccord Genuity painted a bleaker picture noting that the 9% organic growth in the first three quarters of 2022 creates a demanding comparison for the next nine months.
It adds: ‘Our analysis further indicates capex spend by Spirent’s largest customer group, the US service providers (20%-plus of sales), has peaked and will likely decline by a double-digit percentage over the next couple of years. Factoring in likely further operating/capital expenditure budget tightening among Spirent’s other customers, in our view, makes meaningful outperformance of 4% consensus revenue growth expectations less likely this year.’
WHAT SHOULD INVESTORS DO NOW?
If spending by Spirent’s largest customers on 5G has peaked for the time being, then a central part of our reason for recommending the shares has gone. In these circumstances it seems sensible to take our medicine (painful as it is) and walk away with 17.6% loss. Particularly as there appear limited catalysts in the short term which could get the share price moving again. [TS]
14 | SHARES | 26 January 2023 Great Ideas Updates
Sentiment towards telecoms testing firm sours as it warns on 2023 Spirent (p) Apr 2022 JulOctJan 2023 220 240 260 280 Chart: Shares magazine • Source: Refinitiv Spirent
226.6p
to
(SPT)
Loss
date: 17.6%
meaningful outperformance of 4% consensus revenue growth expectations less likely this year”
Coming into its own
Infrastructure as an asset class holds considerable appeal for investors against a volatile backdrop for broader markets…

Infrastructure is an asset class which can provide a high level of security to investors and trusts investing in ‘availabilitystyle’ infrastructure assets are an attractive and defensive variant within this theme.
‘Availability-style’ infrastructure assets are typically a type of public-private -partnership (PPP), where private investment is used to develop and manage public social infrastructure assets, like roads, hospitals or schools. Once a project is complete and meets a set of pre-defined standards (meaning the infrastructure is ‘available’ for use), the investors in the assets keep receiving what are known as ‘availability payments’ as long as the asset remains available for use.
These contractual payments vary in duration, but it’s common for them to last for between 25–35 years and to have high quality inflation linkage. Perhaps the most appealing facet of investment in these infrastructure assets is the fact that payments are government backed.
Availability-style infrastructure assets contrast with demand-based infrastructure assets, where the investor takes on the risk of how much the infrastructure will be used and thus how much revenue it generates. For example, an investor may fund public transport systems or toll roads that end up being used more or less than anticipated, and so will generate more or less cash for investors than originally expected. This problem can become especially acute when an asset experiences a big shock to demand, such as during the pandemic lockdowns or during a recession.
This is a big part of the reason the team at BBGI Global Infrastructure (BBGI) only invest in availabilitystyle critical social infrastructure assets with high-quality inflation linkage. The trust, which is internally managed and led by co-CEOs Duncan Ball and Frank Schramm, has been operating for over a decade and invests in these types of high quality availability-style infrastructure assets that are backed by government contracts in highly rated investment grade countries.
The portfolio, valued at £1.1bn, is currently diversified globally and across 56 critical social infrastructure investments, with exposure to several different asset classes. Approximately half of the portfolio is in transportation, with the remainder in infrastructure assets in healthcare, correctional facilities, education, clean energy and affordable housing.
Having exposure to these assets would likely appeal to the more safety-conscious investor under most circumstances. However, as we seem very likely to be heading into a recession, investing in assets that can produce a regular stream of revenue, backed by government contracts, can start to look a lot more attractive and secure.
Compounding this is the fact that the contracts which BBGI has with its counterparties have revenues with highquality inflation-linkage. This means income from the trust’s investments are protected in real terms even in inflationary environments. Moreover, the income streams won’t be subject to any changes in demand that may result from the economic impact of inflation or a recession.
This is not to say that availability-style assets are riskfree. Failing to keep infrastructure projects available for use, for example, means availability-style payments are not guaranteed. These risks can largely be mitigated through facilities management and insurance agreements. It is also worth noting that BBGI continues to have a high level of asset availability of 99.9%.
Another risk is interest rate hikes which, like government bonds, are putting pressure on valuations across the board. A couple of factors are helping mitigate the impact of interest rate rises for BBGI now and moving forward. One is that BBGI has only a marginal exposure to refinancing risk as the projects themselves are typically either financed on a long term basis with the debt term closely matching the concession term.
Also the individual portfolio companies tend to have substantial cash holdings, which generate an increased income as banks increase the rates of interest they pay. BBGI at a corporate level has mostly remained ungeared over the past decade, but periodically draws upon its £230 million revolving credit facility (maturing in 2026) to acquire assets, which it then repays through equity issuance, avoiding the issue of cash drag. Lastly, the high quality inflation linkage across BBGI’s revenues also works as a partial hedge against rising inflation.
Taking all these factors into account, BBGI’s holdings could be capable of riding out a recession well. The trust is in a position to continue delivering attractive income, even if interest rates rise, inflation continues and the general economy remains soft. Whether or not this will actually happen in practice remains to be seen. But as we enter a period of economic uncertainty, it seems fair to suggest that highly-rated governments will honour their contractual obligations and make availability payments to the suppliers of critical infrastructure like BBGI, even as other business and funds may end up struggling.
Disclaimer
BBGI Global Infrastructure is a client of Kepler Trust Intelligence. Material produced by Kepler Trust Intelligence should be considered as factual information only and not an indication as to the desirability or appropriateness of investing in the security discussed. Kepler Partners LLP is a limited liability partnership registered in England and Wales at 70 Conduit Street, London W1S 2GF with registered number OC334771. Full terms and conditions can be found on www.trustintelligence.co.uk/investor

THIS IS AN ADVERTORIAL
to
on
Click here
read our latest research
BBGI Global Infrastructure…
INVEST FOR LESS
How tracker funds can make your life easier

The fact only a quarter (27%) of fund managers beat the market in 2022 has led many investors to look at low-cost tracker funds. Instead of trying to outperform the market, why not simply mirror what it does and not worry about a fund manager making good or bad decisions.
Exchange-traded funds or ETFs are a form of tracker fund. Their charges are typically a lot lower than an actively managed fund because there is no fund manager to pay. Instead, the ETFs track a specific index whose make-up is based on rules that a computer can manage at little cost. This might be a basket of large shares trading in a certain part of the world or ones which pay generous dividends.
The appeal of ETFs can be illustrated by a single product. For an ongoing charge of just 0.05%, compared with a rough average of around 1% for actively managed funds, investors can use Amundi

Prime Global ETF (PRIW) to gain exposure to more than 1,500 stocks across developed markets. This example of diversification at such a low cost is what’s driven growth in the ETF market since the first such instrument, tracking the FTSE 100 index of UK shares, was listed in London in 2000.
In the intervening 20-plus years the market has expanded hugely, and investors can now invest in a wide variety of markets using ETFs including bonds, property, commodities and even specific themes and investment styles.
In this article we look at the different options and highlight some of the cheapest products. In a separate article, we select some ETFs to create a diversified portfolio from scratch.
16 | SHARES | 26 January 2023
By Tom Sieber Deputy Editor
For many people ETFs are a useful way of tracking the big domestic and overseas indices. A starting point for lots of UK investors will be the FTSE 100 and the iShares Core FTSE 100 (ISF) is both the longest standing UK ETF and one of the most widely held. It charges just 0.07%.
Competition in this area of the market means there isn’t a huge amount to choose between the different ETFs when it comes to cost. Though because of the big fees ETF providers must pay the index providers like FTSE and MSCI, products not tracking mainstream indices can be cheaper.
Lyxor Core UK Equity All Cap (LCUK) follows the Morningstar UK NR index – targeting the top 97% of stocks on the UK market by size – and its charges
What is an ETF?

An
Because
are even lower than the iShares FTSE 100 product at 0.04%. L&G UK Equity UCITS ETF (LGUK) has ongoing charges of 0.05% and tracks the Solactive Core United Kingdom Large & Mid Cap index. It is excluded from our table due to only having £69 million in assets.

For the most part the underlying holdings and performance of these alternative indices will be broadly like their more established counterparts.
Some investors may prefer to play UK stocks through an ETF which tracks the FTSE 250. This mid-cap index has a more domestic focus than the FTSE 100 and has performed better over the long run. There is a clear difference in cost, with Vanguard FTSE 250 (VMID) the cheapest.
26 January 2023 | SHARES | 17
WAYS TO INVEST IN THE UK, US AND OTHER KEY MARKETS Cheapest ETFs for the UK market UK large caps Code for the 'inc' version Code for the 'acc' version Ongoing charge LuxorCoreUKEquity AllCapLCUKn/a0.04% HSBCFTSE100 UCITSETFHUKXn/a0.07% iSharesCoreFTSE 100ETFISFCUKX0.07% VanguardFTSE100VUKEVUKG0.09% UK mid caps VanguardFTSE250VMIDVMIG0.10% iSharesFTSE250MIDDn/a0.40% This is a selection and only includes ETFs with £100 million or more in assets Table: Shares magazine • Source: JustETF, 19 January 2023
exchange-traded fund or ETF
trades
risk.
is a fund which
on a stock exchange. Like any other fund, they diversify an investor’s money across a range of underlying holdings contained within an index thus spreading the
they
they are traded on the stock market,
can be dealt online at a live market price throughout the day, just like regular shares. ETFs are also exempt from stamp duty.
type of
market
value. The


18 | SHARES | 26 January 2023
Cheapest ETFs for the US market InvescoS&P500SPXPSPXD0.05% L&GUSEquityn/aLGUG0.05% iSharesCoreS&P500IUSACSP10.07% VanguardS&P500VUSAVUAG0.07% ETF Code for the 'inc' version Code for the 'acc' version Ongoing charge This is a selection and only includes ETFs with £100 million or more in assets Table: Shares magazine • Source: JustETF, 19 January 2023 Cheapest ETFs for the European market ETF Code for the 'inc' version Code for the 'acc' version Ongoing charge LyxorCoreEURO STOXX50n/aMSED0.07% LyxorCoreSTOXX Europe600n/aMEUD0.07% XtrackersEURO STOXX50XESXn/a0.09% This is a selection and only includes ETFs with £100 million or more in assets Table: Shares magazine • Source: JustETF, 19 January 2023 Why a UK investor cannot buy US-listed ETFs While it is easy to buy US-listed shares, the same does not apply to US-listed ETFs. A UK investor cannot buy a USlisted ETF because the products lack the
information documents
For the US, most mainstream ETF products are focused on the S&P 500 index. From a diversification perspective this makes sense. The alternative US indices include the Dow Jones Industrial Average where the weighting of stocks – how much the movement of an individual share influences the direction of the wider index – is done according to share price rather than rules.
Dow’s composition is also opaque with constituents qualifying by being ‘leaders of the US economy’ and it has a smaller allocation to the big tech companies than the S&P 500. The other big US index is the Nasdaq, which is even more dominated by technology, so the S&P 500 provides a middle ground between the two.
required under European
Why size is important with ETFs

It’s
limited assets (such as less than £100 million) that the product is at risk of being closed if it cannot attract more interest.

These sub-scale ETFs may also have more limited liquidity which leads to a larger spread between the price at which you can buy and sell.
If you are holding an ETF for the long term this might not make a huge difference, however you may well want to rebalance your portfolio if the proportion of stocks to other asset classes has moved above or below your targeted level and here small differences in the cost of trading can add up over time.
26 January 2023 | SHARES | 19 There are ETFs tracking Europe-wide indices and you can also use ETFs to access emerging markets though fees are higher, particularly if you want to target individual markets thanks to the more limited liquidity and accessibility of stocks in the developing world. Cheapest ETFs for emerging markets ETF Code for the 'inc' version Code for the 'acc' version Ongoing charge LyxorMSCIEmerging MarketsE127LEMA0.14% LyxorMSCIEmerging Marketsex-Chinan/aEMXC0.15% iSharesCoreMSCI EmergingMarketsIMIEMGUEMIM0.18% This is a selection and only includes ETFs with £100 million or more in assets Table: Shares magazine • Source: JustETF, 19 January 2023 Cheapest ETFs for global markets ETF Code for the 'inc' version Code for the 'acc' version Ongoing charge AmundiPrimeGlobalPRWUPRIW0.05% LyxorCoreMSCIWorldn/aLCWL0.12% SPDRMSCIWorldn/aSWLD0.12% VanguardFTSE DevelopedWorldVEVEVHVG0.12% XtrackersMSCIWorldXWDLn/a0.12% This is a selection and only includes ETFs with £100 million or more in assets Table: Shares magazine • Source: JustETF, 19 January 2023
an
with only
worth bearing in mind when looking at
ETF
than £100 million, there runs the risk of it being shut down by the provider.
by the time a trend has entered the mainstream to the extent that ETF providers have launched products to tap into it, many of the obvious stocks positioned to harness it may have already rallied.
There are lots of ETFs with an ESG (environmental, social and governance) focus. Some are deliberately geared towards themes in this area while others track versions of existing indices which have been screened using sustainability criteria.
iShares’ range of thematic ETFs are some of the largest, addressing some of the risks around fund size, and include iShares Automation & Robotics
The performance of thematic ETFs has been mixed and there is an argument that a more nuanced, active approach can be a better way of capturing returns from long-term trends. Also,
How do you get income from an ETFs?
ETFs are normally set up for either income or accumulation. The ‘inc’ or income version of ETFs pay out distributions to holders as cash. ‘Acc’ or accumulation ETFs effectively reinvest the dividends for you. So, you need to make sure you buy the right version of the ETF if you want to receive the income as cash.
Some ETFs won’t offer a choice of income or accumulation versions of their fund. If there is no choice, it typically means any dividends will be paid out in cash.
20 | SHARES | 26 January 2023
are ETFs which provide exposure to specific sectors, trends and themes as
asset classes
bonds.
it comes to
competition,
costs
assets
assets
SECTORS AND OTHER AREAS Cheapest thematic ETFs LyxorNetZero 2050S&P500 Climate PABS0.07% UBSGlobalGender EqualityGENE0.20% VanEck SemiconductorsSMH0.35% Wisdomtree Artificial Intelligence INTL0.40% WisdomtreeBattery SolutionsCHRG0.40% WisdomTreeCloud ComputingWCLD0.40% iSharesDigital SecurityLOCK0.40% iShares DigitalisationDGTL0.40% iSharesElectric Vehiclesand DrivingTechnology ECAR0.40% iSharesHealthcare InnovationDRDR0.40% iSharesAutomation &RoboticsRBTX0.40% L&GCleanEnergyRENG0.49% This is a selection and only includes ETFs with £100 million or more in assets Table: Shares magazine • Source: JustETF, 19 January 2023
There
well as other
like
When
thematic ETFs, there is less
so
tend to be higher. The size of an ETF is also more of a consideration as some products attract limited
because of their niche appeal. If an ETF cannot gain scale, such as having
worth more
THEMES,
(RBOT), iShares Digital Security (LOCK) and iShares Global Clean Energy (INRG).
iShares Automation & Robotics is, for example, considerably cheaper than L&G ROBO Global Robotics and Automation (ROBG) with an ongoing charge of 0.4% compared with 0.8% for the latter product. The five-year return for the iShares product is also better at 40.7% compared with 31.7% for the L&G ETF.
Sector-based ETFs often track broad industry categories and typically they don’t follow UK stock market groupings but are more likely to be global, US or regional sectors.
ETFs have been a useful way for ordinary investors to access the bond market, something it is difficult to do directly. Most of the products in this space provide exposure to baskets of government bonds or investmentgrade corporate bonds.
There is also a range of exchange-traded products which track the price of individual commodities and sometimes a basket of them. Instruments offering exposure to gold are particularly popular. Real estate ETFs track stocks with exposure to this sector rather than investing directly in the properties themselves.
STYLES
It is possible to use ETFs to capture different investment styles or factors. Arguably these products blur the line between active and passive management.
Dividend ETFs which would appeal to income investors are more established. There are ETFs which track baskets of high-yielding stocks such as iShares UK Dividend (IUKD) and others that focus on dividend growth like SPDR S&P Global Dividend Aristocrats (SPDR).
Increasingly there are ETFs which are growth or value-focused and some which include stocks with share price momentum, or businesses with attributes which make them higher quality.
There are also several multi-factor products which select investments based on a range of different factors. iShares Edge MSCI World Multifactor (FSWD), for example, tracks firms in developed markets selected according to value, momentum, quality and size.
26 January 2023 | SHARES | 21
Cheapest sector ETFs ETFCodeOngoing charge XtrackersMSCI USABanksXUFB0.12% XtrackersMSCI USAConsumer Staples XSCS0.12% XtrackersMSCI USAHealthCareXUHC0.12% XtrackersMSCI USAInformation Technology XSTC0.12% Cheapest bond ETFs ETFCodeOngoing charge AmundiPrime EuroCorporatesPRIC0.05% AmundiPrime EuroGoviesPRIR0.05% LyxorCoreUK Government Bond GILS0.05% InvescoUS TreasuryBondTRSG0.06% Cheapest commodity ETFs ETFCodeOngoing charge InvescoPhysical GoldSGLD0.12% iShares Diversified Commodity Swap ICOM0.19% This is a selection and only includes ETFs with £100 million or more in assets Table: Shares magazine • Source: JustETF, 19 January 2023

Cheapest income ETFs ETFCodeforthe 'inc'version Codeforthe 'acc'version Ongoing charge FidelityUSQualityIncomeFUSIFUQA0.25% iSharesMSCIEuropeQualityDividendEQDSn/a0.29% VanguardFTSEAll-WorldHighDividendYieldVHYLVHYG0.29% SPDRS&PUKDividendAristocratsUKDVn/a0.30% Cheapest growth ETFs ETFCodeforthe 'inc'version Codeforthe 'acc'version Ongoing charge LyxorRussell1000Growthn/aRSGL0.19% iSharesEuroTotalMarketGrowthLargeIDJGn/a0.40% Cheapest value ETFs ETFCodeforthe 'inc'version Codeforthe 'acc'version Ongoing charge iSharesEdgeMSCIUSAValueFactorIUVDIUVF0.20% iSharesEdgeMSCIWorldValueFactorIWVGIWFV0.30% This is a selection and only includes ETFs with £100 million or more in assets Table: Shares magazine • Source: JustETF, 19 January 2023 CHINA VERSUS INDIA WHERE SHOULD YOU PUT YOUR MONEY? Out on 02 February IN NEXT WEEK'S SHARES
The
emerging markets stocks, to gain exposure to long-term growth drivers linked to positive demographics – i.e., a large working age population – and an emergent middle class.
One of the most compelling attributes of exchange-traded funds, also known as ETFs, is they allow investors to create a diversified investment portfolio from scratch rapidly, easily and inexpensively.
If you bought a product tracking the MSCI World index you could arguably do this at the click of a single button – and by doing so you would gain exposure to more than 1,500 stocks. But that index is not enough for a diversified portfolio.
The unpredictability of markets and the fact the large US market dominates global indices means there is a case for having money in a broader spread of geographies and asset classes.
A GOOD STARTING POINT
Let’s build a portfolio using ETFs which might appeal to someone in their 30s and 40s and who doesn’t need the money for at least 10 years.
For purposes of illustration, let’s say you start with a £10,000 pot and choose to put half of that money into developed market shares. You might want to split it £4,000 into an ETF tracking the MSCI World and £1,000 into a FTSE 250 ETF.
While the FTSE 100 is the London’s market’s flagship index, the mid-cap FTSE 250 has more of a domestic focus and has also performed better than its large-cap counterpart over the long term.
This reflects some of the key qualities of mid-cap investments. They typically have more significant growth potential than FTSE 100 firms and are not as widely followed by analysts so there is a greater possibility of them surprising on the upside with earnings, but they are also not as volatile as small caps and are more likely to pay dividends.
WHAT ELSE MIGHT GO IN THE PORTFOLIO?
You could put £2,000 or 20% of the sum into
That would leave £3,000 to split evenly between other asset classes including bonds, to help cushion some of the volatility of the stock market, commodities and property.
To create our portfolio, we have focused on ETFs which offer low charges (with an average ongoing charge of just 0.15%) and sufficient scale (at least £100 million in assets).
Where possible we have included an accumulation class of ETF, which automatically
26 January 2023 | SHARES | 23
Exchange-Traded Funds: Building a portfolio
We select six ETFs providing exposure to stocks, bonds, commodities and property
build a diversified portfolio
A beginner ETF portfolio: How to allocate £10,000 LyxorCore MSCIWorld ETF LCWL40% 4,000 VanguardFTSE 250ETFVMIG10% 1,000 LyxorMSCI Emerging MarketsETF LEMA20% 2,000 iSharesCore Global Aggregate BondET AGGU10% 1,000 iShares Diversified Commodities SwapETF COMM10% 1,000 VanEckGlobal RealEstate ETF TREG10% 1,000 ETF Code Percentage of portfolio £ Table: Shares magazine • Source: JustETF, data to 23 January 2023
quick and easy way to
using cheap tracker funds
Exchange-Traded Funds: Building a portfolio

reinvests any income from underlying investments. This assumes the portfolio is for someone with a long investment horizon who may not need income from their investments in the short term.
SELECTING APPROPRIATE ETFS
There are six constituents in our ETF portfolio –someone looking for a slimmed down, simplified version could consider halving that number by allocating 70% to the MSCI World ETF alone, 20% in the bond product and 10% in the property vehicle.
Lyxor MSCI World ETF
(LCWL) £11.29
Ongoing charge: 0.12%
This ETF tracks the performance of more than 1,500 large and mid-cap stocks across 23 developed market countries including Microsoft (MSFT:NASDAQ) and Johnson & Johnson (JNJ:NYSE). On a 10-year view the annualised return from the underlying index is more than 8%.


Lyxor MSCI Emerging Markets ETF
(LEMA) £38.48
Ongoing charge: 0.14%
This is among the cheapest ETFs offering exposure to the emerging markets space. It tracks the MSCI Emerging Markets index which includes the world’s leading chip manufacturer Taiwan Semiconductor (2330:TPE), Chinese e-commerce group Alibaba (BABA:NYSE) and Indian tech firm Infosys (INFY:NSE). In the 22 years up to the end of 2022 the annualised return from the MSCI Emerging Markets index has outpaced the developed market MSCI World at 7.5% versus 5.4%.
Vanguard FTSE 250 ETF
(VMIG) £33.25
Ongoing charge: 0.1%
This tracks the FTSE 250 index – in effect the 250 next largest companies after the FTSE 100 on London’s Main Market. Its largest allocation is to financials, but it is more diversified than the FTSE 100 with a large exposure to industrials too. Top constituents include mining services specialist Weir (WEIR), renewable energy trust Greencoat UK Wind (UKW) and engineering firm IMI (IMI).
24 | SHARES 26 January 2023
Exchange-Traded Funds: Building a portfolio
iShares Core Global Aggregate Bond ETF
(AGGU) £4.16
Ongoing charge: 0.1%
Looking to match the performance of the Bloomberg Barclays Global Aggregate Bond index, this ETF offers exposure to both government and corporate bonds. This includes the debt of pharmaceutical giant AbbVie (ABBV:NYSE) and US bank Morgan Stanley (MS:NYSE).
commodities, industrial metals and gold –benefiting from growing demand linked to population growth as well exposure to the metals and other commodities required to help deliver a transition away from fossil fuels.

Van Eck Global Real Estate ETF

(TREG) £32.27
Ongoing charge: 0.2%
Like all property-based ETFs this invests in listed property companies – conveying the advantage that the underlying investments are easy to buy and sell and enabling it to keep costs low. It follows the GPR Global 100 index – which tracks 100 developed market real estate firms. Members of the index include US real estate investment trust Prologis (PLD:NYSE). Property offers income as well as diversification and, as a so-called real asset, often performs well during inflationary periods.
iShares Diversified Commodities Swap ETF
(COMM) £5.76
Ongoing charge: 0.19%
At a stroke this product provides access to commodities like oil and gas, agricultural

26 January 2023 | SHARES | 25
Foreign currency ETFs explained and how exchange rates affect performance
Holidaymakers will be familiar with exchanging pounds for euros and dollars when making trips abroad.
A weak pound can make that trip more expensive, or a strong pound can result in extra cash to spend.
Exchange rates also impact investing in overseas markets, but unlike the holidays example a weak pound has a positive benefit for investors as we explain in this article.

Exchange-traded funds or ETFs often have different currency classes available which gives investors greater choice but deciding which one is best can seem daunting.
Don’t be put off, because the listing currency doesn’t make much difference to the return investors receive. It’s the currency of the underlying investments in the ETF that matters.
Before getting into the details, it is worth emphasising currencies are notoriously difficult to predict. So much so that analysts don’t bother trying to forecast future exchange rates when drawing up their company earnings estimates.
Historically currencies have been more volatile (annual price variability or fluctuation) than bonds or fixed interest securities and less volatile than shares.
HOW DOES IT WORK?
Currencies can help performance and be a source of return as well as a risk. Let’s start with a single company example.
If Jim purchased 100 shares of Tesla (TSLA:NASDAQ) at $130 for $13,000 his investment platform provider should convert the US price into pounds and deduct exchange rate fees and commissions.
Let’s say Jim received an exchange rate of
$1.23 dollars to the pound. The cost before charges is £10,569.
If the pound weakens (buys fewer dollars) from $1.23 to say $1.05 in a year’s time Jim will earn a bigger return due to the increased value of the dollar. Let’s say Tesla shares rise 20%.
The sale price of Tesla would be $156 a share giving US proceeds of $15,600 and a dollar profit of $2,600 (20%). But when converted back into sterling Jim would receive $15,600/$1.05 which is £14,857.
So, in pounds Jim’s profit would be £14,857 minus £10,569 which is £4,287, or 40%, doubling his dollar return.
These dynamics apply to all overseas investments which need to be converted back into pounds including ETFs that hold foreign stocks.
But ETFs offer investors the choice of buying foreign currency classes such as a US dollar class or sterling class.
In the former, investors incur exchange rate costs to convert pounds into dollars. In the latter, they don’t. But ultimately the pounds need to be converted by the fund to be invested into US shares.
Buying the GBP class saves exchange rate fees when converting the purchase and sales from dollars back into sterling.
26 | SHARES | 26 January 2023
Investing outside the UK creates foreign currency exposure which can both help and hinder returns
For example, the Vanguard S&P 500 ETF (VUSA) priced in pounds has returned 51.2% over the last five years. The same ETF priced in US dollars (VUAA) has returned 48.9%.
When considering global funds there are more currencies impacting performance, but the principles are the same. A weak pound will enhance returns and a strong one will detract. Another thing to consider is that because global

funds are exposed to several currencies, they tend to naturally hedge each other as rising currencies are offset by falling ones.

It is possible to buy GBP hedged ETFs which aim to remove underlying currency effects. But they do not eliminate all the risk and they can cost more because hedging can be expensive. ETFs which are hedged will have ‘GBP Hedged’ in the description.


BONDS ARE DIFFERENT
Investors do not buy bonds for capital growth but rather for their stable income and portfolio stabilisation qualities. Bond prices tend to move up when equities move down, but this isn’t always the case as 2022 showed.
Global bond ETF providers usually hedge foreign currency exposure to minimise the risk of wiping out the relatively low fixed return and reduce volatility.
By
Editor
VUSA
2020202120222023 −20 0 20 40 60 S&P 500 ETF in dollars S&P 500 ETF in pounds Chart: Shares magazine • Source: FE Analytics
VS VUAA
The Merchants Trust PLC (MRCH) [LIVE WEBINAR] 4 PM Tue, 7 February 2023 REGISTER Presenting: Portfolio Manager Simon Gergel Watch all our past company presentations on ShareSoc's Youtube channel www.sharesoc.org
Martin Gamble Education
Investment Trusts: a rare opportunity in UK small and mid-sized companies

UK equities were more resilient than many other world markets in 2022. Within the market, investors displayed a clear preference for larger, more international FTSE 100 companies. The extent of the underperformance of small and mid-caps (“smids” for short) is rare and, in the past, such periods have usually been followed by longer spells of outperformance.
The UK smids market encompasses more than 1,000 companies. They may be less well-known than companies in the FTSE 100, but that doesn’t mean they’re not world-leading companies capable of generating superior returns. There are plenty of well-run, innovative and disruptive UK smids, with market-leading positions in new and emerging industries.
Recovery prospects
The acute underperformance of UK smids in 2022 is piquing the interest of a variety of investors as they look to 2023. Historically, it is unusual for UK smids to underperform to the extent that they did last year. When it has occurred, a period of strong outperformance versus the FTSE 100 has usually followed.
In part, this is because underperformance often leads to more attractive valuations. Meanwhile, with a longer runway of growth ahead of them, investing in small and mid-sized businesses should ultimately deliver superior performance. Many academic studies have evidenced the premium returns on offer from smaller companies.
Opportunity knocks
It can be argued that UK stocks are cheap for a reason, and economic and political events clearly undermined confidence in 2022. Nevertheless, it is always worth remembering that it’s during challenging periods that opportunities can be most plentiful.
Sue Noffke, Head of UK Equities at Schroders, sees a diverse range of attractive opportunities across
both domestic and global-facing UK smids:
“We see opportunities in both the ‘domestics’ serving the UK consumer and business end user, and the many internationally-focused smids. There is no silver bullet to the issues facing the UK economy, where more than 20% of the working age population is economically inactive. Valuations, however, are very beaten up and the market does not seem to be discerning between the good and less good companies.”
Ultimately, some of the higher quality businesses in this part of the market may prove vulnerable to bids. Mid cap companies may be in the sweet spot here, as Andy Brough, Head of the Schroders PanEuropean Small and Mid Cap Team explains:
“Should we see a resumption of bids for cheap UK assets, mid cap companies can be the target of choice – not too big, but sufficiently large to make a difference for the acquirer. As companies are taken out it helps make room for the next tranche of exciting FTSE 250 entrants (only around 20 of the original constituents from 1999 are still in the index today) helping to create a dynamism perhaps not there in other areas of the market.”
ADVERTISING FEATURE
Schroder UK Mid Cap Fund plc
As the name suggests, the Schroder UK Mid Cap Fund plc may be viewed as an attractive way of accessing the opportunity in UK smids. The highly experienced team, led by Jean Roche, views the UK mid cap investment universe as the source of the UK’s star businesses of tomorrow and has an impressive track record.
Jean Roche looks to build a high conviction portfolio of 40-50 resilient companies that are capable of delivering dependable long-term growth. She is not complacent about the economic challenges but is confident that the disciplined investment approach continues to deliver a portfolio capable of capturing the attractive opportunity that lies ahead.
Schroder Income Growth Fund plc
The current attractive opportunity in UK smids can also be embraced by portfolios with a broader mandate. Take the Schroder Income Growth Fund plc, for example. The Company has raised its dividend every year since its launch in 1995*, making it an attractive proposition for income-seeking investors.
It may invest anywhere across the UK market cap spectrum and the portfolio has a bias towards larger companies. Nevertheless, the investment opportunity in UK smids is well represented within the current strategy, with more exposure to this part of the market now than ever before.
Conclusion
There is clearly an exciting opportunity among UK small and mid-sized companies currently, but as is always the case, it is not without risk. The war against inflation is far from over. Even the best companies are struggling to pass on higher costs in a cost of living crisis of historic proportions.
Higher interest rates could be a major issue for companies with high levels of borrowings, especially if that debt needs to be refinanced soon.
However, many of the best UK smids have made it through the pandemic and, with the support of strong balance sheets and attractive starting valuations, they are well prepared to weather whatever storms lie ahead.
* Source: AIC/Morningstar, July 2022.
Fund risk disclosures
The company may borrow money to make further investments, this is known as gearing. Gearing will increase returns if the value of the investments purchased increase by more than the cost of borrowing, or reduce returns if they fail to do so. In falling markets, the whole of the value in that investment could be lost, which would result in losses to the fund.
As a result of fees being charged to capital, the distributable income of the company may be higher but there is the potential that performance or capital value may be eroded.
The company may be concentrated in a limited number of geographical regions, industry sectors, markets and/or individual positions. This may result in large changes in the value of the company, both up or down, which may adversely impact the performance of the company.
Important information
This information is a marketing communication.
Past Performance is not a guide to future performance and may not be repeated. The value of investments and the income from them may go down as well as up and investors may not get back the amounts originally invested. Exchange rate changes may cause the value of investments to fall as well as rise.
The material is not intended to provide, and should not be relied on for, accounting, legal or tax advice, or investment recommendations.
Reliance should not be placed on any views or information in the material when taking individual investment and/or strategic decisions.
Schroders has expressed its own views and opinions in this document and these may change.
We recommend you seek financial advice from an Independent Adviser before making an investment decision. If you don’t already have an Adviser, you can find one at www.unbiased.co.uk or www.vouchedfor.co.uk
Before investing in an Investment Trust, refer to the prospectus, the latest Key Information Document (KID) and Key Features Document (KFD) at www.schroders.co.uk/investor or on request.
Issued in January 2023 by Schroder Unit Trusts Limited, 1 London Wall Place, London EC2Y 5AU. Registration No 4191730 England. Authorised and regulated by the Financial Conduct Authority
Find out more at www.schroders.com/investmenttrusts
ADVERTISING FEATURE
Why real estate stocks could be a good bet for the medium term
Experts and analysts see valuations bottoming out this year
The severe tightening in financial conditions in the second half of 2022 caused commercial property values to fall at the fastest six-month rate on record.
As a result of much cheaper valuations, investors are asking themselves whether now is a good time to start taking positions in listed property companies and real estate investment trusts, also known as REITs.
We look at where valuations are, where they could go, and which stocks look the most attractive.
WHAT HAS HAPPENED TO VALUATIONS?
One key thing retail investors need to appreciate about property companies is the importance of interest rates in determining valuations.
Property is an income-generating asset, and changes in interest rates affect the rate of return investors require on their investment.
Before March 2020, the Bank of England’s official bank rate (also known as the ‘base rate’) was 0.75%, but within weeks of the Covid crisis the bank cut its rate first to 0.25% and then to 0.1%, a 325-year low.
As a result, the yield on UK government bonds or gilts – considered the ‘risk-free’ rate – slumped, allowing rental yields on property to fall and valuations to soar.
The best-performing property assets were retail warehouses and prime logistics centres as households shifted to shopping online.
With the pandemic in the rear-view mirror, the Bank of England began raising rates in December 2021, since when it has hiked the base rate nine times to 3.5%, meaning higher yields on gilts and property stocks.
Just as lower rates sparked a jump in valuations,
so higher rates have seen valuations fall sharply, with the worst-affected sectors being logistics and ‘big-box’ retail which previously gained the most.
According to commercial property valuation expert CBRE, which compiles an index based on the value of over 1,000 commercial properties and 31 monthly-valued funds worth in total over £16 billion, overall capital values fell by 13.3% in 2022. That compares with a 13.8% post-pandemic bounce-back in 2021.
Industrial assets fell 21% in value, followed by a decline of 12.1% in offices and 8.1% in retail.
On a positive note, rental values rose 4.7%, the strongest since the millennium, with industrial rents up 10.3%, offices up 2% and a 0.5% increase for retail.
As a result, the total return for each sector was -18.1% for industrial assets, -8.2% for offices, and -2.1% for retail, with the overall total return -9.1% for the year.
IS THERE MORE DOWNSIDE TO COME?
The consensus view is that commercial property valuations will keep falling this year due to more interest rate rises, a UK economy which is weakening if not already in recession and continuing macro-economic uncertainty due to the ongoing conflict in Ukraine.
There are still valuation concerns over parts of the retail sector exposed to the cost-of-living crisis
30 | SHARES | 26 January 2023
Feature: Real estate stocks
REPRICING OF ASSET VALUES
Capital values are falling faster this timeThe rebound in capital values post trough
May 93
Jul 09
Nov 89
Jun 07Jun 22
0% -5% -10% -15% -20% -25% -30% -35% -40% -45% -50%
0 4 12 16 20 24 28 32 36 40
Months from peak
Source: MSCI, CBRE, Peel Hunt
and parts of the office sector which need upgrading to meet new environmental standards, but most parts of the market are not overbuilt and there are supply shortages in some areas.
Therefore, the jury is out over how much further valuations will fall this year before confidence returns, but CBRE notes there is still an abundance of debt and equity capital available and towards the end of last year prices were beginning to firm, attracting buyers into the market.
Analysts Matthew Saperia and James Carswell at Peel Hunt are optimistic the bottom is near given the speed with which values have already fallen.
‘The quicker we reach the bottom the quicker investment activity will restart and the quicker we will find clarity on valuations and NAVs (net asset values). It feels to us like we could be close, and the sector is typically quick to rerate in such circumstances,’ they argue.
‘The sector-wide share price implied property yield sits at 6.3% on an equivalent basis, offering a significant spread over the risk-free rate,’ they add, while the quality and exposure of the listed sector is ‘far superior to the broader benchmark’.
Richard Shepherd-Cross, managing director of Custodian Property Income REIT (CREI), which invests in smaller commercial properties across the country, believes valuations have overshot to the downside in many cases.
‘There is an expectation that commercial property yields should show a premium over gilts,
18% 16% 14% 12% 10% 8% 6% 4% 2% 0%
0 1 2 3 4 5 6 7 8 9 10 11 12
Months from trough
Source: MSCI, CBRE, Peel Hunt
the risk-free rate, but don’t overlook rental growth. ‘Certain sectors could be oversold if growth isn’t factored in, and there is a very strong case for rental growth in smaller lot-size industrial and logistics assets, regional offices where clients are offered a high level of service and amenity, and in some retail locations where values have fallen too far.’
COULD THERE BE TAKEOVERS?
Michael Nicholson, Peel Hunt’s head of mergers and acquisitions, believes higher operating costs combined with higher interest rates highlight ‘the merits of scale’ for many UK companies.
Historically, the main acquirers of UK firms over the past five years have been North American, but in the property sector most deals have been domestic such as last year’s merger proposal between Shaftesbury (SHB) and Capital & Counties Properties (CAPC)
While deals have been few and far between since Covid, share-price premiums for transactions have been healthy at around 25% reflecting the big discounts to net asset value in the sector and a tendency by sellers to leave the door open to attract competing bids.
The Peel Hunt team believe private equity firms are likely to be looking at UK property, and we note that US investment giant Blackstone (BX:NYSE) has been active raising capital and deploying it in property assets in the past year.
26 January 2023 | SHARES | 31
2022: what doesn’t kill you makes you stronger
The painful adjustment to an environment of higher inflation and interest rates was the financial market story of 2022. A tough combination of the war in Ukraine, the legacy of the exceptional policy response to the pandemic and disrupted supply chains pushed prices higher for energy, agricultural commodities and, increasingly, labour. Central banks were forced to raise interest rates to curb these pressures.
These stresses were mostly felt in short-term inflation expectations, while longer-term expectations moved only slightly. Nevertheless, the short-term moves were severe. In the UK, inflation hit levels of 13-14%, the highest levels seen since the early 1980s. The Bank of England raised rates nine times from December 2021, pushing up gilt yields, peaking at the time of the shambolic Truss/Kwarteng mini-budget.
Whilst this created an extremely difficult backdrop for stock markets, 2022 was not without its success stories: the UK’s larger companies were flattered by a weaker sterling (a significant share of their revenues comes from overseas) and by the strong performance of commodity-related sectors. However, the domesticallyfocused FTSE 250 saw double-digit falls for the year.
Sector performance was significantly influenced by the interest rate cycle. Companies with high debt, or little pricing power struggled as the economic environment weakened and borrowing costs soared. Energy was the year’s stand-out performer, but there were other pockets of resilience, including healthcare, utilities
and consumer staples. The worstperforming sectors were domestic cyclicals such as real estate, consumer discretionary and technology. There was a significant rotation away from growth and towards ‘value’ sectors. Sentiment towards UK assets was volatile. There can be little doubt that the mini-budget left the UK on the naughty step for many investors. The subsequent Autumn statement stabilised the situation, but the UK is still viewed carefully for any signs fiscal discipline may be lapsing.
The trust in review

It was a year of two halves for Dunedin Income Growth Investment Trust (DIGIT). Amid the uncertainty during the first six months of 2022, our main focus was to test the thesis for all the companies in the portfolio against the new economic environment, and make any adjustments. Selectively, we added to existing holdings when share prices fell back and made a few selective sales. We exited GSK (formerly GlaxoSmithKline) and Haleon, for example and added to Unilever, Aveva and the London Stock Exchange. These are all good quality businesses with long-term growth prospects that had been sold down.
In the second half of the year, as more clarity emerged and markets adjusted to higher inflation and interest rates, we started to look more closely for new opportunities. This included switching out of Persimmon and adding Taylor Wimpey, adding insurance group Hiscox, while also introducing Oxford Instruments, a specialist industrial manufacturer of high tech industrial equipment. At the moment, we are finding the most significant opportunities among domestic cyclical companies, where share prices have
been hit hard. That includes companies such as Morgan Sindall and Marshalls.
The trust is well-balanced for defensiveness and recovery. It should be resilient if the economic environment worsens – the earnings and balance sheets for companies in the portfolio are likely to be more robust. However, if investors become more confident and enthused, we have been increasing our exposure to UK mid cap, domestically-focused businesses, so would hope to participate in that recovery. We are minutely focused on getting company selection right – if we do, share prices will follow.
The year ahead?
At the start of 2023, the market remains focused on inflation and interest rates: where will inflation level out? How quickly will it subside? Will it become embedded in wages? In all scenarios, markets will be watching central banks’ next move. It is likely that, barring a significant shock, we are closer to the end than the beginning of the tightening cycle.
Perhaps this may even mean that investors will have a less intensive focus on interest rates and inflation this year. The market had a significant adjustment to make in 2022, but expectations now appear more settled. This may finally allow a greater focus on the specific characteristics of individual
 Ben Ritchie and Rebecca Maclean, Investment Managers, Dunedin Income Growth Investment Trust PLC
ADVERTISING FEATURE
companies, after a year when inflation data and the latest guidance from the US Federal Reserve occupied investor attention.
We would certainly welcome more focus on individual businesses. This is where we spend our time, looking at how a business is performing from a revenue, profit, cash flow and dividend point of view. Broader market sentiment and macroeconomic data are important, but these factors tend to be unpredictable. In the year ahead, we hope to spend less time talking about inflation and more time talking about profitability.
Optimism versus pessimism
There are a wide range of outcomes for 2023 and we believe share price performance may vary considerably depending on the company and individual subsector. There are
Important Information
plenty of reasons for caution with UK consumers facing the rising cost of living, higher mortgage rates and interest costs. Similarly, forwardlooking global economic indicators are negative, and some of the more economically sensitive sectors may have to lower their forecasts. The key questions though are how much of this is priced in and do companies have the strength of balance sheet and cash generation to trade through what may be difficult times ahead. In that regard we are optimistic that for those able to take a medium-term view that there are attractive opportunities emerging.
There also remain pockets of strength. For example, The US Inflation Reduction Act and the need to drive energy security will support sectors such as renewables across the world. Likewise there remains strong structural growth drivers in areas such
Risk factors you should consider prior to investing:
• The value of investments, and the income from them, can go down as well as up and investors may get back less than the amount invested.
• Past performance is not a guide to future results.
• Investment in the Company may not be appropriate for investors who plan to withdraw their money within 5 years.
• The Company may borrow to finance further investment (gearing). The use of gearing is likely to lead to volatility in the Net Asset Value (NAV) meaning that any movement in the value of the company’s assets will result in a magnified movement in the NAV.
• The Company may accumulate investment positions which represent more than normal trading volumes which may make it difficult to realise investments and may lead to volatility in the market price of the Company’s shares.
• The Company may charge expenses to capital which may erode the capital value of the investment.
• Derivatives may be used, subject to restrictions set out for the Company, in order to manage risk and generate income. The market in derivatives can be volatile and there is a higher than average risk of loss.
• There is no guarantee that the market price of the Company’s shares will fully reflect their underlying Net Asset Value.
as healthcare, speciality chemicals and financial services. We are also more optimistic on the prospects for consumers in emerging markets, particularly in Asia. Companies providing essential products and services to these end markets, with strong competitive positions and resilient financials should be wellplaced to navigate an uncertain period ahead. Looking to balance the portfolio between exposure to both structural growth and selective cyclical opportunities is where we see the best combination of risk adjusted returns in 2023.
Companies selected for illustrative purposes only to demonstrate the investment management style described herein, and not as an investment recommendation or indication of performance.
• A s with all stock exchange investments the value of the Company’s shares purchased will immediately fall by the difference between the buying and selling prices, the bid-offer spread. If trading volumes fall, the bid-offer spread can widen.
• Certain trusts may seek to invest in higher yielding securities such as bonds, which are subject to credit risk, market price risk and interest rate risk. Unlike income from a single bond, the level of income from an investment trust is not fixed and may fluctuate.
• Yields are estimated figures and may fluctuate, there are no guarantees that future dividends will match or exceed historic dividends and certain investors may be subject to further tax on dividends.
Other important information:
Issued by abrdn Fund Managers Limited, registered in England and Wales (740118) at 280 Bishopsgate, London EC2M 4AG. abrdn Investments Limited, registered in Scotland (No. 108419), 10 Queen’s Terrace, Aberdeen AB10 1XL. Both companies are authorised and regulated by the Financial Conduct Authority in the UK.
Find out more by registering for updates. You can also follow us on social media: Twitter and LinkedIn
ADVERTISING FEATURE
The real catalyst for the FTSE 100 to hit a new record high
You could make ‘very good money’ from UK stocks, according to a well-respected fund manager
The FTSE 100 approaching a new record high puts the spotlight on UK stocks again. The index is full of shares which should thrive in the current environment – value stocks, energy producers, defensive sectors like tobacco and healthcare, and banks which benefit from higher interest rates. Valuations are cheap and dividends are generous. Key to pushing the UK market higher is luring back foreign investors.
Predictions of a big slowdown in economic growth this year due to recession don’t help, neither does the recent turmoil within the UK Government. However, markets are forward looking, and so much bad news is already in the price.
Getting a good entry point is crucial in investing and one could argue that UK equities are incredibly cheap now. Just imagine if we started to see foreign investors load up on FTSE 100 stocks. That could provide the tailwind to take the index well above its May 2018 record high.
‘The UK is incredibly unpopular in global terms, and I think there is only upside,’ says Mark Slater, manager of Slater Growth Fund (B7T0G90). ‘It would take very little to really move the market if international investors switched on to the UK.
‘Anyone who wants to be out of the UK is out so there is an awful lot of scope for upside surprise in the UK market. The precise timing is not something I think is worth agonising about. If you are looking three to five years ahead, I think people will make very good money.’

If interest rates stay elevated, then the growth stocks that populate the upper echelons of the US market could continue to find life hard. Value stocks
should do better, and the UK has them in spades.
The UK became less attractive to international investors after the UK voted seven years ago to leave the EU. ‘International investor aversion to the region intensified amid trading and regulatory uncertainty,’ says Jo Rands, portfolio manager and research analyst at asset manager Martin Currie. ‘Today, the UK valuation discount versus the rest of the world remains over 30% lower than it was in June 2016.’

The negativity has lingered, exacerbated by institutional investment decisions becoming more centralised. ‘There has been an increasing preference for global allocations,’ Rands explains. ‘The US makes up circa 50% of the global benchmarks versus just 4% for the UK. This is evident when we consider actively managed asset flows over the past 36 months – UK equity asset classes have endured outflows of $79 billion versus inflows of over $300 billion for global equity asset classes over the same period.’
These UK outflows have resulted in bargains galore, so what would it take for foreign investors to reappraise the FTSE 100’s constituents? Another bad year with US stocks might do it.
It seems increasingly likely the impact of an economic slowdown will cause many large US companies to miss earnings expectations, particularly if their margins are being squeezed by demand weakness and high staff costs.
There remains a compelling argument to own UK stocks and you want to already have a position before overseas investors flock back. As Mark Slater says, it’s hard to say when that will happen, but the reasons for them doing so are growing day by day.
36 | SHARES | 26 January 2023 Editor’s View: Daniel Coatsworth
Insightful commentary on
very year this column tracks the ratings put on stocks across the FTSE 100 and FTSE 350 by the investment banks which provide research on the UK equity market. This time, the analyst community is the most bullish it has ever been since our first survey back in 2015, based on stock-specific, public recommendations.
Russ Mould
Bell Investment Director

Table:
Buys Holds Sells
over the past nine years respectively and matching those of 2022. For the FTSE 350 index 63% of all recommendations are positive ratings and just 8% negative ones, the highest and joint-lowest since we began this survey in 2015.
Shares is not endorsing these views, but investors could be forgiven for wondering whether this is a signal to buy more London-traded stocks or a warning to cut exposure to UK equities.

Momentum players may feel inclined to go with the positive flow. Contrarians may take the
Buys Holds Sells
Table: Shares magazine • Source: Refinitiv data, analysts consensus, Marketscreener. Data as of 6 January 2023
26 January 2023 | SHARES | 37
market issues
reveal the names with the most amount of ‘buy’ or ‘sell’ ratings
are the most and least popular stocks heading
2023? Analysts are more bullish than ever on FTSE 100 and FTSE 250 stocks as we enter 2023 FTSE 100 2015 47%39%14% 2016 47%40%13% 2017 45%40%15% 2018 49%37%14% 2019 52%36%12% 2020 46%38%16% 2021 54%35%14% 2022 57%33%9% 2023 57%34%9% Average 2015-2023 51%37%13% Buys Holds Sells Table: Shares magazine • Source: Refinitiv data, analysts consensus, Marketscreener. Data as of 6 January 2023 FTSE 250 2015 52%38%10% 2016 49%40%11% 2017 48%38%14% 2018 48%40%13% 2019 50%40%10% 2020 48%40%12% 2021 55%35%10% 2022 62%31%8% 2023 63%29%8% Average 2015-2023 53%37%11% Buys Holds Sells Table: Shares magazine • Source: Refinitiv data, analysts consensus, Marketscreener. Data as of 6 January 2023 FTSE 250 2015 52%38%10% 2016 49%40%11% 2017 48%38%14% 2018 48%40%13% 2019 50%40%10% 2020 48%40%12% 2021 55%35%10% 2022 62%31%8% 2023 63%29%8% Average
53%37%11%
AJ
We
E
As we enter 2023, 57% of all stock ratings are ‘buys’ and just 9% are ‘sells’ for constituents of the FTSE 100, the joint-highest and joint-lowest scores Which
into
2015-2023
Shares magazine • Source: Refinitiv data, analysts consensus, Marketscreener. Data as of 6 January 2023
FTSE 250 2015 52%38%10% 2016 49%40%11% 2017 48%38%14% 2018 48%40%13% 2019 50%40%10% 2020 48%40%12% 2021 55%35%10% 2022 62%31%8% 2023 63%29%8% Average 2015-2023 53%37%11%
Russ Mould
AJ Bell Investment Director
opposite view as they bear in mind legendary investor Sir John Templeton’s maxim that ‘bull markets are founded on pessimism, grow on scepticism, mature on optimism and die on euphoria.’
One way to research which path may be the best one to follow is the assess the efficacy of individual analyst recommendations.
HERD MENTALITY
This column has backtested the performance on the most and least popular stocks at the start of a year, as measured by the percentages of ‘buy’ and ‘sell’ ratings attributed to them by analysts.
The bad news is the analysts’ top picks failed to beat the FTSE 100 index in every year between 2015 and 2022, apart from 2019.
This is not to poke fun. It just shows how hard picking individual stocks can be, even if it is your full-time job. The least popular FTSE 100 names from the 2022 group did badly as expected, with an aggregate total return of -20.5% against the +4.7% provided by the benchmark index. Knowing which names to avoid can be every bit as valuable as knowing which names to buy.
Analysts can take a little more satisfaction from how their labours worked out across the FTSE 350. When it came to the broader index, five of the 10 most popular names among analysts outperformed in 2022, although a couple of clunkers meant the

Insightful commentary on market issues
group overall did worse than the FTSE 350. The least popular 10 stocks did terribly as forecast, with an overall negative total return of 28.2%. Only one of the 10 least popular names beat the FTSE 350, so the research was spot on.
HIGH CONVICTION
The conclusion must be that broker research needs to be treated with a degree of caution, certainly in the cases where stocks seem universally popular.
It is when analysts publish ‘sell’ ratings that they really stick their neck out. You can argue it is the picks when analysts go against the crowd that come with greater conviction and thus may be worthy of greater attention.
Anyone prepared to pick their own stocks rather than pay a fund manager or use an index-tracker fund to do it for them must do their own research on individual companies before they even think about buying or selling the shares.
Warren Buffett is spot on with his observation that, ‘you cannot buy what is popular and do well.’
With that maxim in mind, investors might like to know which stocks are most liked – and disliked –by analysts at the start of 2023.
The tables list the names which investors may wish to analyse in greater depth, or simply avoid altogether, depending upon their view of the value of the research provided.
38 | SHARES | 26 January 2023


26 January 2023 | SHARES | 39
100: Biggest percentage of 'buy' ratings
2022
National
Flutter Entertainment
AstraZeneca
DCC
Barratt Developments
Buy
100: Biggest percentage of 'sell' ratings in 2022
Rightmove
Sage
Hargreaves
Ocado
Antofagasta
Dechra Pharmaceuticals
Rolls Royce
Admiral
Severn
Buy
FTSE
in
Total return CRH 800100%(12.9%) Vodafone 232092%(19.5%) British American Tobacco 182090%28.5% Entain 172089%(21.0%) Taylor Wimpey 171189%(36.9%)
Grid 141188%(1.3%)
202187%(4.0%)
262287%32.5%
130287%(30.1%)
173085%(41.4%) Total (10.6%) FTSE 100 total return 4.7%
Hold Sell Buy % 2022 Table: Shares magazine • Source: Refinitiv data, analysts consensus, Marketscreener. Refers to number of analysts with buy, hold or sell ratings per stock FTSE
Total return Abrdn 15857%(14.9%)
45847%(14.9%)
78732%(10.4%)
Lansdown 84425%(34.0%)
88524%(53.2%)
49424%23.6%
43222%(50.0%)
59422%(24.2%)
65321%(20.4%)
Trent 29321%(6.7%) Total (20.5%)
Hold SellSell %2022 Table: Shares magazine • Source: Refinitiv data, analysts consensus, Marketscreener. Refers to number of analysts with buy, hold or sell ratings per stock


40 | SHARES | 26 January 2023
FTSE 350: Biggest percentage of 'buy' ratings in 2022 total return
OSB Group 1300100%(8.4%) Serco 1300100%17.2% Future 1000100%(66.7%) TBC Bank 900100%50.4% CRH 800100%(12.9%) Chemring 800100%2.3% National Express 800100%(49.5%) 888 Holdings 700100%(71.2%) Diversified Energy 700100%24.2% IG 600100%1.7% Total (11.3%) FTSE 350 total return 0.8% Buy Hold Sell Buy % 2022 Table: Shares magazine • Source: Refinitiv data, analysts consensus, Marketscreener. Refers to number of analysts with buy, hold or sell ratings per stock FTSE 350: Biggest percentage of 'sell' ratings in 2022 total return TUI 23758%(43.7%) Frasers 11250%(7.9%) Rightmove 45847%(14.9%) Hammerson 19844%(26.3%) Renishaw 42440%(21.7%) Domino's Pizza 32338%(34.2%) Sage 78732%(10.4%) Carnival 34330%(58.1%) Johnson Matthey 77630%7.9% Ashmore 46429%(10.9%) Total (22.0%) Buy Hold SellSell %2022 Table: Shares magazine • Source: Refinitiv data, analysts consensus, Marketscreener. Refers to number of analysts with buy, hold or sell ratings per stock


26 January 2023 | SHARES | 41 FTSE 100: Biggest percentage of 'buy' ratings at start of 2023 CRH 700100% Shell 181095% Endeavour Mining 141093% JD Sports Fashion 131093% Smurfit Kappa 101091% Prudential 180290% Entain 172089% Glencore 172089% 3i 81089% Beazley 152088% Buy Hold Sell Buy % Table: Shares magazine • Source: Refinitiv data, analysts consensus, Marketscreener. Refers to number of analysts with buy, hold or sell ratings per stock FTSE 100: Biggest percentage of 'sell' ratings at start of 2023 Abrdn 33960% Kingfisher 39737% Rolls Royce 47531% Sainsbury's 36431% Bunzl 58528% Ocado 76528% Severn Trent 45325% Sage 106524% Vodafone 88524% Rightmove 89523% Buy Hold Sell Sell % Table: Shares magazine • Source: Refinitiv data, analysts consensus, Marketscreener. Data as of 6 January 2023. Refers to number of analysts with buy, hold or sell ratings per stock


42 | SHARES | 26 January 2023 FTSE 350: Biggest percentage of 'buy' ratings at start of 2023 Centamin 1000100% Future 1000100% Grafton 900100% Network International 900100% Diversified Energy 800100% Energean 800100% CRH 700100% Hill & Smith 700100% IG Group 700100% NCC 700100% Buy Hold Sell Buy % Table: Shares magazine • Source: Refinitiv data, analysts consensus, Marketscreener. Data as of 6 January 2023. Refers to number of analysts with buy, hold or sell ratings per stock FTSE 350: Biggest percentage of 'sell' ratings at start of 2023 Abrdn 33960% Ashmore 42545% TUI 04343% Kingfisher 39737% easyJet 93633% Rolls Royce 47531% Sainsbury's 36431% ASOS 615930% Bunzl 58528% Ocado 76528% Buy Hold Sell Sell % Table: Shares magazine • Source: Refinitiv data, analysts consensus, Marketscreener. Data as of 6 January 2023. Refers to number of analysts with buy, hold or sell ratings per stock
Why
Hotels is turning investor heads

Warren Buffett says the best businesses are ones that can sustainably grow without needing to raise extra money, and on this basis InterContinental Hotels (IHG) ticks the right boxes.
The company is one of the world’s largest hotel businesses, operating brands such as InterContinental, Crowne Plaza, Holiday Inn, and more. With about 888,000 rooms globally, it is estimated to have a market share of more than 4%.
What sets it apart from many other hotel chains is its asset-light model. Where many peers own their bricks and mortar, most of InterContinental Hotels’ rooms are run on a franchise basis, with 99% of rooms operated under franchised agreements or managed on behalf of third-party hotel owners. That means the company does not own an extensive real estate portfolio.
As a result, it has relatively low running and maintenance costs, making InterContinental Hotels more robust in a slowing economy.
The model has paid off superbly for investors in the past. If you’d put £5,000 into the stock 10 years ago and reinvested dividends, the stake would now be worth £18,820 versus £9,199 from a FTSE 100 tracker excluding fees, based on data from FE Analytics.
InterContinental Hotels’ full year results are scheduled to be published on 21 February. Bank of America anticipates $381 million of free cash flow for 2022 from a 56% jump in operating profit to $834 million. Free cash flow is forecast to hit $526 million in 2023. This is the money left after
keeping the business going to spend on dividends, share buybacks, debt reduction and acquisitions. If Bank of America is correct, investors could be looking at $1.279 (103.5p) per share in dividends for the 2022 financial year versus $0.859 in 2021 and nothing from Covid-hit 2020. That’s roughly a 2% yield.
Much of the anticipated progress in revenue per available room will be driven by a boom in travel across China where the company has substantial exposure.
InterContinental Hotels has a pipeline of approximately 278,000 new rooms, which is more than 30% of the current estate of hotel rooms already in use. Approximately one third (36%) of the new rooms are in China and the same again in the Americas (35%). Forty percent of the pipeline is already under construction.

Recent trading has been encouraging with revenue per available room above 2019 levels since July 2022. China has been well below pre-Covid times but there are hopes this will change as the economy starts to reopen thanks to pandemic restrictions being lifted. [SF]
By Steven Frazer News Editor
26 January 2023 | SHARES | 43 Feature: InterContinental Hotels
Asset-light model and exposure to reopening China to drive progress
InterContinental
£5,000 invested in InterContinental Hotels 10 years ago would today be worth £18,820 InterContinental Hotels (p) 20142016201820202022 0 2,000 4,000 6,000 Chart: Shares magazine • Source: Refinitiv
UK equities – reasons for optimism in 2023
2022 was not the year that economists predicted. What was forecast to be a year of steady economic recovery following the pandemic was instead a year in which war returned to Europe. This brought significantly higher-than-expected inflation driven by higher energy prices, putting material pressure on real household disposable income and indirectly adding to disruption elsewhere in the UK economy, notably in the form of widespread industrial action. Cost of living pressures on the consumer, as well as disappointingly low business investment, means that the UK economy is already likely in modest recession, with market consensus for a slight economic contraction in 2023.
UK equities ended 2022 flat
In this difficult economic backdrop, it is perhaps surprising that UK equities ended 2022 almost flat with the FTSE All-Share Index delivering total returns of 0.34% (Refinitiv Datastream, 12 months to 31 December 2022). A large part of this headline resilience, however, is due to the unusual sectoral make-up of the UK equity market, with a comparatively high concentration in companies that benefit from higher commodity prices. It has been these large natural resource companies (such as Shell, BP and Glencore) that have driven the majority of UK outperformance versus overseas equity markets in 2022. In contrast, outside of this narrow selection of stocks, on average UK share prices fell materially in 2022. This can be demonstrated by comparing the returns of UK companies by size, with only the top 20 companies in the FTSE 100 showing positive share price performance (Figure 1).
The sharp share price falls seen across small and medium-sized UK companies in 2022 can be explained by the fact that these companies on average, have more domestic exposure in terms of sales and earnings, and tend to be more economically sensitive. Therefore, as the market
KEY TAKEAWAYS
• In 2022, the largest commodity-related UK companies significantly outperformed small and medium-sized UK companies, which suffered due to their higher domestic exposure in terms of sales and earnings, as well as more economically-sensitive businesses.
• Factors including a build-up in consumer savings, low unemployment and healthy UK company balance sheets could mean that there is a greater likelihood of a modest, rather than severe UK recession.
• Our current focus is on UK smaller companies, which saw the steepest underperformance in 2022 and suggests to us that this is likely to be where the best investment opportunities can be found.

THIS IS AN ADVERTISING PROMOTION
Figure 1: 2022 returns by UK company size groupings FTSE100'top20'15.7% FTSE100'bottom80'−17.2% FTSE250−17.4% FTSESmallCapexInv Trusts−17.3% FTSEAIMAll-Share−30.7% 2022 Total Returns % Source: Bloomberg, calendar year 2022 total returns in GBP terms. Past performance does not predict future returns.
Portfolio manager Laura Foll provides the arguments for a modest rather than severe UK recession and discusses why UK smaller companies are currently looking attractive.
attempts to ‘price in’ a more challenging economic backdrop, these companies bear the brunt of share price falls. The key question for us as fund managers, therefore, is whether the market has already adequately reflected upcoming earnings weakness, or whether there is further downside to share prices from current levels.
A modest rather than severe recession for the UK is likely Forecasting the longevity and depth of any recession will always be challenging; attempting any degree of precision with economic forecasting is likely to be a fool’s errand. That being said, when considering whether the UK equity market has adequately priced in economic weakness, there are two key variables to determine:
• What could be the depth and longevity of the recession?
• What is the starting point in terms of valuations?
For this particular recession, the key factors to consider are:
• There was a build-up of savings by UK consumers during the course of the pandemic that is yet to be fully spent. It remains unclear at what pace these savings will be drawn down, but it provides the consumer with a potential ‘buffer’ to withstand the cost of living pressures.
• The labour market is therefore entering the recession from a position of ‘tightness’, and ultimately the key factor in consumer spending power is whether someone retains their job.

• Bank lending has remained subdued since the Global Financial Crisis (GFC), with banks instead focusing on rebuilding their balance sheets and implementing strict affordability tests with regards to, for example, mortgage lending. This means that despite recent interest rate rises we are yet to see any notable balance sheet stress at major UK lenders (while there have been some pockets of stress seen elsewhere, such as the pension funds industry).
• UK-listed company balance sheets generally remain healthy. This is partly due to timing, as many companies raised financing during COVID, and they have yet to fully work through this additional capacity (with this recession coming unusually only two years after the last one).
We of course need to recognise that despite the above reasons for optimism there are significant external factors which we cannot possibly predict – the outcome of the war in Ukraine, for example. However, as fund managers we always operate with varying degrees of uncertainty and therefore need to take a view on the balance of probability. The above factors mean that, in our view, there is a greater likelihood of a modest, rather than severe, recession. This brings us onto where UK valuation levels currently sit.
UK stocks remain cheap UK equities continue to trade at a significant valuation discount to overseas peers (MSCI UK Index versus MSCI World Index 12-month forward price-to-earnings (P/E). This valuation gap began to emerge in 2016 and is now wider than it has been in over 25 years – see Figure 2:
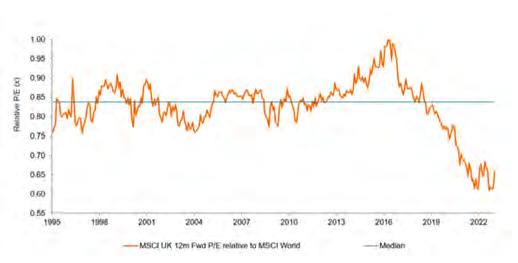
Figure 2: UK stocks’ valuation gap to global peers widest in 25 years
Source: JP Morgan Research as at 3 January 2023. Past performance does not predict future returns.
As mentioned earlier, 2022 saw significant underperformance of small and medium-sized
THIS IS AN ADVERTISING PROMOTION
companies. Therefore, while UK equities as a whole trade at a discount to overseas peers, within the UK the lowest valuation is currently seen within the smallest companies (listed on the FTSE Small-Cap Index – see Figure 3).
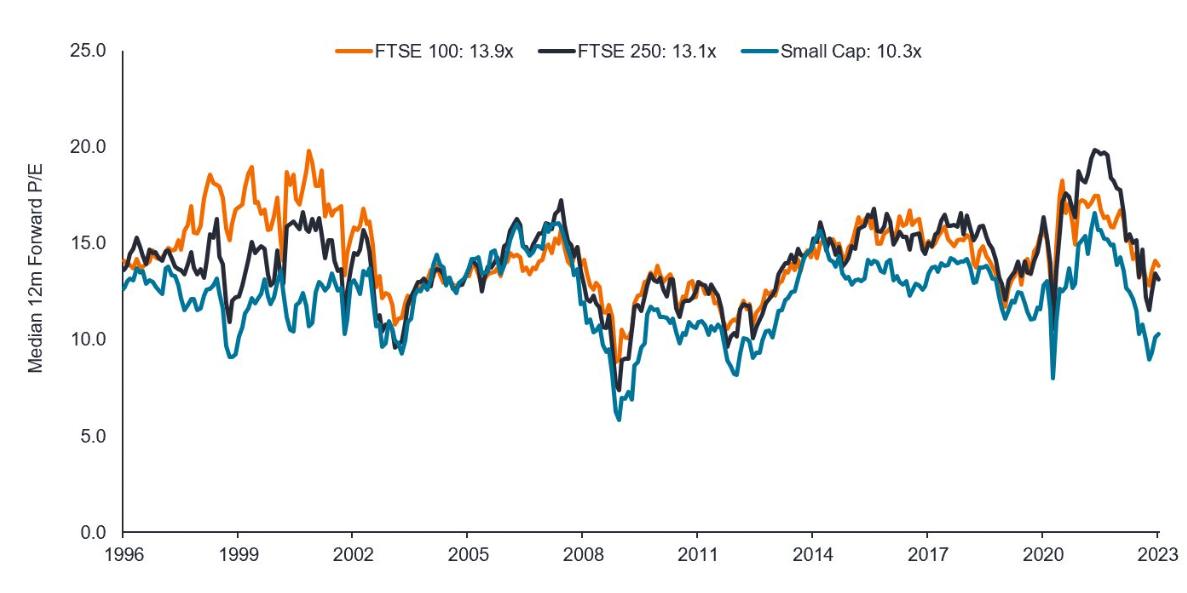
Bringing all of this together, we could be entering a modest recession at a point where UK smaller company valuations are already trading at levels rarely seen outside of severe recessions such as
the GFC and the pandemic. That does not mean there is not further potential downside to share prices, or that there will not be economic shocks to come, however it does suggest to us that a significant degree of economic ‘pain’ is already reflected in UK share prices. Our current focus is on UK smaller companies, which saw the steepest underperformance in 2022 and suggests to us that this is likely to be where the best investment opportunities can be found.
Figure 3: Smaller companies are the most undervalued
Source: Liberum, Refinitiv Datastream, as at 1 January 2023. Past performance does not predict future returns.
These are the views of the author at the time of publication and may differ from the views of other individuals/teams at Janus Henderson Investors. Any securities, funds, sectors and indices mentioned within this article do not constitute or form part of any offer or solicitation to buy or sell them.
Past performance does not predict future returns. The value of an investment and the income from it can fall as well as rise and you may not get back the amount originally invested.
The information in this article does not qualify as an investment recommendation.
Marketing Communication. The value of an investment and the income from it can fall as well as rise and you may not get back the amount originally invested.
Unless otherwise stated all data is sourced from Janus Henderson Investors.
We may record telephone calls for our mutual protection, to improve customer service and for regulatory record keeping purposes.
Janus Henderson, Knowledge Shared, Knowledge Labs are trademarks of Janus Henderson Group plc or one of its subsidiaries. © Janus Henderson Group plc.
GC-0123-121490 01-31-24 TL
THIS IS AN ADVERTISING PROMOTION
Important information
Before investing in an investment trust referred to in this document, you should satisfy yourself as to its suitability and the risks involved, you may wish to consult a financial adviser. This is a marketing communication. Please refer to the AIFMD Disclosure document and Annual Report of the AIF before making any final investment decisions.
• If a Company's portfolio is concentrated towards a particular country or geographical region, the investment carries greater risk than a portfolio diversified across more countries.
• Some of the investments in this portfolio are in smaller companies shares. They may be more difficult to buy and sell and their share price may fluctuate more than that of larger companies.
• This Company is suitable to be used as one component in several in a diversified investment portfolio. Investors should consider carefully the proportion of their portfolio invested into this Company.
• Active management techniques that have worked well in normal market conditions could prove ineffective or detrimental at other times.
• The Company could lose money if a counterparty with which it trades becomes unwilling or unable to meet its obligations to the Company.
• Shares can lose value rapidly, and typically involve higher risks than bonds or money market instruments. The value of your investment may fall as a result.
• The return on your investment is directly related to the prevailing market price of the Company's shares, which will trade at a varying discount (or premium) relative to the value of the underlying assets of the Company. As a result losses (or gains) may be higher or lower than those of the Company's assets.
• The Company may use gearing as part of its investment strategy. If the Company utilises its ability to gear, the profits and losses incured by the Company can be greater than those of a Company that does not use gearing.
References made to individual securities should not constitute or form part of any offer or solicitation to issue, sell, subscribe, or purchase the security. Janus Henderson Investors, one of its affiliated advisors, or its employees, may have a position mentioned in the securities mentioned in the report.
Not for onward distribution. Before investing in an investment trust referred to in this document, you should satisfy yourself as to its suitability and the risks involved, you may wish to consult a financial adviser. This is a marketing communication. Please refer to the AIFMD Disclosure document and Annual Report of the AIF before making any final investment decisions. Past performance does not predict future returns. The value of an investment and the income from it can fall as well as rise and you may not get back the amount originally invested. Tax assumptions and reliefs depend upon an investor’s particular circumstances and may change if those circumstances or the law change. Nothing in this document is intended to or should be construed as advice. This document is not a recommendation to sell or purchase any investment. It does not form part of any contract for the sale or purchase of any investment. We may record telephone calls for our mutual protection, to improve customer service and for regulatory record keeping purposes.
Issued in the UK by Janus Henderson Investors. Janus Henderson Investors is the name under which investment products and services are provided by Janus Henderson Investors International Limited (reg no. 3594615), Janus Henderson Investors UK Limited (reg. no. 906355), Janus Henderson Fund Management UK Limited (reg. no. 2678531), Henderson Equity Partners Limited (reg. no.2606646), (each registered in England and Wales at 201 Bishopsgate, London EC2M 3AE and regulated by the Financial Conduct Authority) and Janus Henderson Investors Europe S.A. (reg no. B22848 at 2 Rue de Bitbourg, L-1273, Luxembourg and regulated by the Commission de Surveillance du Secteur Financier).
Janus Henderson, Knowledge Shared and Knowledge Labs are trademarks of Janus Henderson Group plc or one of its subsidiaries. © Janus Henderson Group plc
THIS IS AN ADVERTISING PROMOTION
Why a £100,000 limit on ISAs is a bad idea

Savers and investors should be encouraged to put money aside, not presented with more complexities
Last week the Resolution Foundation put forward a radical proposal. The leftleaning thinktank believes the maximum anyone should be able to build up in an ISA is £100,000.
Its policy experts argued that too little is being saved and invested by low-income households leaving millions with little or no safety net to fall back on.
But it doesn’t follow that the answer is to curb the tax breaks for today’s savers and investors to fund additional tax incentives for those not currently saving. Robbing Peter to pay Paul is overly simplistic.
For starters, the proposal is complicated. The Resolution Foundation suggests no more money be paid into ISAs once the £100,000 threshold is reached, and any returns which exceed £100,000 would be taxed.
It isn’t clear what would happen when the £100,000 is reached either. Will part of the ISA be converted into a dealing account? Or forcibly withdrawn by the account owner?
The Resolution Foundation also intends for this to apply retrospectively, moving the goalposts for those who have already built up this amount, in good faith.
Secondly, a lifetime limit on ISAs would penalise success. The average annual stocks and shares ISA contribution is £8,875, according to HMRC.
Someone investing this amount each year and achieving 6% annual investment growth would hit the £100,000 cap in nine years. Even a more modest annual investment of £5,000 would hit the cap in 13 years.
And those who started investing early would be the most likely to exceed the £100,000 limit thanks to the wonder of compound growth. One of the golden rules of investing is to start as soon as possible, but a cap on ISAs would muddy the waters.
Finally, will this proposal really help anyone? The amount the Treasury could gain from investors with over £100,000 in ISAs will have to be spread very thin amongst the millions of people with no savings.
Put starkly, those who have more money, save. And those who don’t have much can’t afford to, regardless of the incentive on offer. A freedom of information request from AJ Bell revealed that just 2.5% of eligible people have used Help to Save, a scheme with 50% savings bonus for low-income households. Would throwing more money at it to give even bigger tax advantages really help to change behaviour?
Some 12 million people subscribe to an ISA each year. Let’s not ruin the success of a simple and effective policy and punish millions of savers and investors by heaping on unnecessary layers of complexity.
By Rachel Vahey AJ Bell’s head of policy development

48 | SHARES | 26 January 2023 Feature: ISA limit
VIDEOS
WATCH RECENT PRESENTATIONS

discoverIE Group
Simon Gibbins, Group Finance Director & Lili Huang, Head of Investor Relations
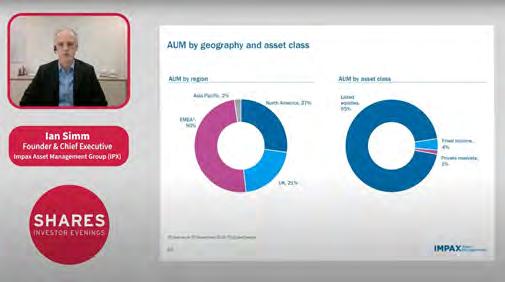
discoverIE is an international group of businesses that designs and manufactures innovative electronic components used in industrial applications. They work with original equipment manufacturers globally in finding unique solutions for their technical challenges.
Trident Royalties (TRR)
Adam Davidson, CEO
Trident Royalties PLC (TRR) plan to rapidly establish itself as a diversified mining royalty and streaming company, providing investors with exposure to base and precious metals, bulk materials (excluding thermal coal) and battery metals.
Impax Asset Management Group (IPX)

Ian Simm, Founder & Chief Executive
Impax Asset Management Group (IPX) offers a range of listed equity, fixed income and private markets strategies. All strategies utilise the firm’s specialist expertise in understanding investment opportunities arising from the transition to a more sustainable economy.
Visit the Shares website for the latest company presentations, market commentary, fund manager interviews and explore our extensive video archive.
TO PLAY EACH VIDEO SPOTLIGHT
CLICK
WEBINAR www.sharesmagazine.co.uk/videos
Emerging markets outlook
Sponsored by Templeton Emerging Markets Investment Trust
Why emerging markets could be on the cusp of a green revolution
According to the United Nations Environment Programme Finance Initiative, emerging markets may need up to $1 trillion a year to build a netzero economy. This is clearly a significant challenge but also brings significant investment opportunities and growth potential. Volatile energy prices in 2022 have helped to further incentivise development in this sphere.

The World Economic Forum has pointed to the crucial role that domestic banks in the developing world might play in leading a push towards sustainability. In a June 2022 report it noted: ‘Helping local banks to define and implement a netzero strategy can be a game-changer for the muchneeded energy transition in the emerging markets. This will unlock the potential of new projects accelerating net-zero ambitions.’
The report adds: ‘Globally, climate capital and expertise are there; however, to scale the equitable distribution of resources including capital, it’s absolutely key to build local partnerships, and local banks are ably placed to provide that strength and ownership to achieve climate targets.’
There has been progress in terms of financing the big investment required to help decarbonise emerging market economies with the International Monetary Fund reporting that sustainable debt issuance in these economies more than tripled in 2021 to $190 billion. Flows into sustainable equity funds also rose to $25 billion.
The MSCI Emerging Markets ESG Leaders index contains companies with high performance on environmental, social and governance metrics compared with their peers.
Over the 10 years to 31 December 2022, it
MSCI Emerging Markets ESG Leaders index – sector breakdown
Financials (21.7%)
Information technology (17.8%)
MSCI Emerging Markets ESG Leaders index – sector breakdown
Communication services (14.3%)
Consumer discretionary (13.1%) Materials (7.4%) Industrials (6.2%)
Financials (21.7%)
Information technology (17.8%)
Communication services (14.3%)
Consumer staples (6.0%) Energy (4.9%) Healthcare (3.9%) Utilities (2.5%) Real estate (2.2%)
Consumer discretionary (13.1%) Materials (7.4%) Industrials (6.2%) Consumer staples (6.0%) Energy (4.9%) Healthcare (3.9%) Utilities (2.5%) Real estate (2.2%)
Chart: Shares magazine • Source: MSCI, data to 31 December 2022
outperformed the MSCI Emerging Markets index with an annualised return of 3.6% against 1.8% from the broader benchmark.
Chart: Shares magazine • Source: MSCI, data to 31 December 2022
The index has a significant weighting to financials, information technology and communication services.
This outlook is part of a series being sponsored by Templeton Emerging Markets Investment Trust. For more information on the trust, visit here
50 | SHARES | 26 January 2023
The UN says the developing world will need $1 trillion per year of investment to build a net-zero economy
Emerging markets: Chinese reopening, a big renewables push and an earnings recovery

seeks to become self-sufficient in photovoltaic panel production.

1.China dismantles its zero-Covid policies: The removal of almost all Covid-19 restrictions in China is resulting in a wave of infections, with up to 80% of people in urban areas contracting the virus. As the wave subsides, economic activity is expected to normalise. Durable goods and financial services are likely beneficiaries of a resumption in normal patterns of human interaction and trade. A recovery in outward-bound tourism is expected to benefit economies in Asia, which prior to 2020 were the prime beneficiaries of the large number of Chinese tourists.

2.Acceleration in renewable energy investments: The ‘new normal’ of elevated fossil fuel prices is likely to incentivise emerging markets to accelerate decarbonisation efforts in order to reduce energy costs and meet their Paris Climate accord targets. This will create potential opportunities for emerging market investors. The battery industry – for both electric vehicles and battery electric storage systems – as well as the solar industry, stand out. China and South Korea are at the forefront of new battery technologies, commanding 83% global market share between January and October 2022. India is also investing heavily in the solar industry as it
3.Policy pivot: As we head further into 2023, we find many reasons to be constructive about emerging markets. Markets such as Chile and Indonesia have started to pause interest-rate hikes or scale back the magnitude of their rate hikes. We expect a policy pivot to revive consumption and spur economic growth as inflation slows. In addition, after a slowdown in earnings in 2022, there is a prospect for a recovery in earnings growth in 2023. We view China as a leader with a near-15% estimated growth, based on consensus expectations. However, we are of the view that earnings may continue to still be relatively weaker in China in the near term, with a recovery timed toward the end of 2023 instead. Nonetheless, a pickup in earnings revisions in emerging markets would signify better times ahead for earnings and in turn, equities.
26 January 2023 | SHARES | 51
Emerging markets outlook
What the experts at Franklin Templeton see coming in 2023
Sponsored by Templeton Emerging Markets Investment Trust
Chetan Sehgal
Singapore
TEMPLETON EMERGING MARKETS INVESTMENT TRUST (TEMIT)
Porfolio Managers
Andrew Ness Edinburgh
TEMIT
is the UK’s largest and oldest emerging markets investment trust seeking long-term capital appreciation.
What is ‘pound-cost ravaging’ and how does it affect my pension?

Can you please explain ‘pound-cost ravaging’?
It’s a term I’ve heard several times but have yet to fully grasp how it works or whether it’s something I should be concerned about. I’m 64 and planning to start taking an income from my SIPP in 2025 (when I’ll become entitled to a state pension worth around £10,000 a year). My SIPP is worth just over £200,000 and I’ve already taken my 25% tax-free cash.
pensions each valued at £200,000. Both are taking £15,000 a year out of their pots, rising each year by 2%.
Jack experiences investment returns in the first five years of: -10%, +4%, +4%, +4%, +4%. As a result, his pot is worth just over £125,000 at the end of that period.
When you are building up a savings pot, experts often recommend drip-feeding money into investments to smooth out the impact of market volatility. This works because it avoids having to time the market. Instead, you buy into investments on a regular basis, usually monthly.
When markets dip, you can buy more units of an investment; when markets rise, the same amount of money buys you fewer units. The outcome of this approach is often referred to as ‘pound-cost averaging’.
Taking a flexible income from your pension is called drawdown and the remainder of the pot stays invested. The benefits of drawdown include having the flexibility to manage withdrawals to suit your needs and giving your pot the opportunity to benefit from long-term growth.
However, drawdown also comes with risks. Let’s say you’re taking large withdrawals in the early years of retirement and your investments suffer big falls – something plenty of people will have experienced over the last 12 months or so. It’s harder to regain the lost ground. This is often called ‘pound-cost ravaging’ and is best demonstrated with an example.
Take two 65-year-olds, Jack and Jane, with
Jane, meanwhile, experiences the same returns, but in a different order: +4%, +4%, +4%, +4%, -10%. At the end of the period, her pot is worth almost £135,000.
In other words, simply by experiencing bad investment performance in year one rather than year five, Jack has been left with a pension worth around £10,000 less than Jane.
This is one of the reasons it’s important to keep your drawdown strategy under review and be prepared, if necessary, to adjust your withdrawals. This should help ensure your retirement income plan remains on track.

DO YOU HAVE A QUESTION ON RETIREMENT ISSUES?
Send an email to asktom@sharesmagazine.co.uk with the words ‘Retirement question’ in the subject line. We’ll do our best to respond in a future edition of Shares.
Please note, we only provide information and we do not provide financial advice. If you’re unsure please consult a suitably qualified financial adviser. We cannot comment on individual investment portfolios.
52 | SHARES | 26 January 2023 Ask
Your
Tom:
retirement questions answered
It’s an important concept to understand if you’re taking money out of a retirement pot
Paul
Tom Selby, AJ Bell Head of Retirement Policy, says:
Premium Bonds prize fund has risen – but are they worth it?

S&I has increased the prize fund on Premium Bonds once again, as it tries to keep up with the rates war in the savings market. The Governmentbacked provider has added £80 million in prizes each month, meaning this month it expects to pay out almost £300 million in prizes. From February it will further boost the prizes on offer, handing out more than £314 million each month.
However, the odds of winning haven’t increased, and still stand at 24,000 to 1. It just means that if you do win a prize, it’s more likely to be of a higher amount. So how does the prize fund work, is it worth buying Premium Bonds and are there particular people who would benefit more?
WHAT IS THE PRIZE FUND RATE?
NS&I produces the ‘annual prize fund rate’ to give savers a comparison for how Premium Bonds stack
up against more conventional savings accounts that pay interest. This can be misleading, as it’s based on the average prize you’d win if you had average luck. In reality, no one has average luck.
From February this prize fund rate will be 3.15%. What that figure means is that for every £100 held in Premium Bonds £3.15 is paid out of the prize fund, but only a few people will win the big prizes. Two people each month win £1 million, which means thousands of other Premium Bond holders will win absolutely nothing.
ARE PREMIUM BONDS WORTH IT?
It all comes down to personal preference. If you opt for a conventional savings account, you are guaranteed the headline interest. Currently, the highest rate you can get on an easy-access account is 3%. That means if you save £20,000, you’ll get £600 in interest in the next 12 months.
If you put that money in Premium Bonds
26 January 2023 | SHARES | 53
Personal Finance: Premium Bonds
look at the pros and cons of the popular savings and investment product
We
N
Number and value of Premium Bonds prizes £1,000,00022 £100,0001859 £50,00036117 £25,00071236 £10,000178590 £5,0003591,177 £1,0004,37912,573 £50013,13737,719 £100731,2251,280,509 £50731,2251,280,509 £253,496,5002,376,161 Total: £218,993,750 Total: £314,347,875 Value of prizes Number of prizes in December 2022 Number of prizes in February 2023 (estimated) Table: Shares magazine • Source: NS&I
Personal Finance: Premium Bonds
instead you could win £1 million but you could also get absolutely nothing. So, it comes down to whether you want a guaranteed return or are willing to gamble in the hope of winning big.
Another factor to bear in mind is that if you only have a very small sum saved with Premium Bonds you’re not as likely to win. It’s a bit like buying tickets for a raffle; if you only have one ticket in the pot it’s less likely your name will come out of the hat, but if you have 1,000 tickets in there, you’re much more likely to be picked. If you only have £100 saved in Premium Bonds your chance of winning is lower than someone with £1,000 or £10,000.
BUT WHAT ABOUT THE OTHER PERKS OF NS&I, ISN’T IT GOVERNMENT-BACKED?
With money held in a regulated bank or building society, £85,000 is protected by the Financial Services Compensation Scheme if the provider goes bust. In this situation you’ll automatically get your money back.
The £85,000 limit is per person, per financial institution. However, some people with more savings than this amount won’t want the hassle of spreading the cash across multiple banks or building societies. In this situation, it’s worth noting that the Government will guarantee everything you invest in NS&I products including Premium Bonds, not simply up to £85,000.
HOW ABOUT THE FACT THAT THE PRIZE WINNINGS ARE TAX FREE?
The other big perk of Premium Bonds is that any winnings are tax free. The appeal of this waned when the Personal Savings Allowance was introduced, which meant that the first £1,000 of savings interest was tax free for basic-rate taxpayers and the first £500 for higher-rate taxpayers. Additional-rate taxpayers get no allowance.
It means that many people don’t pay tax on their savings interest. However, with interest rates rising and more people being pushed into the next income tax bracket, more people will start to pay tax on their savings now. Therefore, the tax-free element of Premium Bonds has regained some appeal. But you must weigh up whether it’s worth the risk of getting potentially no return.

PREMIUM BONDS CHECKLIST
Premium bond holders can see if they’ve won a prize by going to the NS&I website or by using Amazon’s Alexa voice-activated service
Winners can receive the prizes by cash or opt to automatically reinvest the money into new Premium Bonds
Prizes worth more than £5,000 are not automatically paid out. Instead, winners will be sent a claim form by post to complete – apart from those lucky enough to win £1 million who will receive a visit from a NS&I representative in person
Premium bonds cannot be held in an ISA or personal pension
 By Laura Suter
Bell Head of Personal Finance
By Laura Suter
Bell Head of Personal Finance
54 | SHARES | 26 January 2023
AJ
ARTISANAL SPIRITS
COMPANY PLC (LON: ART)
A curator and provider of premium single cask Scotch malt whisky and other spirits for sale primarily online to a discerning global membership.
MERCIA ASSET MANAGEMENT (LON:MERC)

A proactive, specialist asset manager focused on supporting regional SMEs to achieve their growth aspirations.
OROCO RESOURCE CORP (TSX-V:OCO.V)
The Santo Tomas deposit is an emerging copper giant, with a multi-million tonne resource demonstrated by historical exploration.

RAMSDEN HOLDINGS PLC (LON: RFX)

A diversified financial services provider and retailer operating in the following core segments: Foreign currency; Pawnbroking; Purchases of precious metals segment; Jewellery retail segment and Income from other financial services.

Reserve your place now! 09 FEBRUARY 2023 Registration and coffee: 17.15 Presentations: 17.40 Sponsored by Register for free now www.sharesmagazine.co.uk/events COMPANIES PRESENTING LIVE EVENT RADISSON BLU HOTEL THE HISTORIC ROYAL MILE During the event and afterwards over drinks, investors will have the chance to: • Discover new investment opportunities • Get to know the companies better • Talk with the company directors and other investors
Shares magazine is published weekly every Thursday (50 times per year) by AJ Bell Media Limited, 49 Southwark Bridge Road, London, SE1 9HH. Company Registration No: 3733852.


All Shares material is copyright. Reproduction in whole or part is not permitted without written permission from the


iShares Edge MSCI World Multifactor ETF 21


iShares UK Dividend ETF21
L&G
L&G UK Equity UCITS ETF17
Lyxor Core UK Equity All Cap ETF 17
Lyxor MSCI Emerging Markets ETF 24
Lyxor MSCI World ETF24
SPDR S&P Global Dividend Aristrocrats ETF 21
Van Eck Global Real Estate ETF 25
Vanguard FTSE 250 ETF 17, 24
Vanguard S&P 500 ETF27
Shares publishes information and ideas which are of interest to investors. It does not provide advice in relation to investments or any other financial matters. Comments published in Shares must not be relied upon by readers when they make their investment decisions. Investors who require advice should consult a properly qualified independent adviser. Shares, its staff and AJ Bell Media Limited do not, under any circumstances, accept liability for losses suffered by readers as a result of their investment decisions.
Members of staff of Shares may hold shares in companies mentioned in the magazine. This could create a conflict of interests. Where such a conflict exists it will be disclosed. Shares adheres to a strict code of conduct for reporters, as set out below.
1. In keeping with the existing practice, reporters who intend to write about any securities, derivatives or positions with spread betting organisations that they have an interest in should first clear their writing with the editor. If the


editor agrees that the reporter can write about the interest, it should be disclosed to readers at the end of the story. Holdings by third parties including families, trusts, self-select pension funds, self select ISAs and PEPs and nominee accounts are included in such interests.
2. Reporters will inform the editor on any occasion that they transact shares, derivatives or spread betting positions. This will overcome situations when the interests they are considering might conflict with reports by other writers in the magazine. This notification should be confirmed by e-mail.
3. Reporters are required to hold a full personal interest register. The whereabouts of this register should be revealed to the editor.
4. A reporter should not have made a transaction of shares, derivatives or spread betting positions for 30 days before the publication of an article that mentions such interest. Reporters who have an interest in a company they have written about should not transact the shares within 30 days after the on-sale date of the magazine.
Index 56 | SHARES | 26 January 2023
EDITOR: Daniel Coatsworth @Dan_Coatsworth DEPUTY EDITOR: Tom Sieber @SharesMagTom NEWS EDITOR: Steven Frazer @SharesMagSteve FUNDS AND INVESTMENT TRUSTS EDITOR: James Crux @SharesMagJames EDUCATION EDITOR: Martin Gamble @Chilligg COMPANIES EDITOR: Ian Conway @SharesMagIan CONTRIBUTORS: Danni Hewson Laith Khalaf Russ Mould Tom Selby Laura Suter WHO WE ARE
editor.
DISCLAIMER ADVERTISING Senior Sales Executive Nick Frankland 020 7378 4592 nick.frankland@sharesmagazine.co.uk Main Market BT 10 Capital & Counties Properties 31 Grainger 33 GSK 6 Haleon 6 IMI 24 InterContinental Hotels43 Land Securities 32 Premier Foods 6 Reckitt 7 Restaurant Group 6 Saga 9 Shaftesbury 31 Shell 10 Spirent 14 Thungela Resources9 Unilever 7 Weir 24 Overseas shares AbbVie 25 Alibaba 24 Amazon 11 Blackstone 31 Illumina 7 Infosys 24 Johnson & Johnson24 Meta Platforms 11 Microsoft 24 Morgan Stanley 25 PepsiCo 12 Procter & Gamble 7 Prologis 25 Salesforce 6 Taiwan Semiconductor24 Tesla 7, 26 Investment Trusts Assura 32 Custodian Property Income REIT 31 Greencoat UK Wind24 Henderson Far East Income 13 LXi REIT 32 Scottish Mortgage Investment Trust 7 Funds Slater Growth Fund36 ETFs
Prime Global ETF 16 iShares Automation & Robotics ETF 20 iShares Core FTSE 100 ETF 17
Core Global Aggregate Bond ETF 25
Amundi
iShares
iShares Digital Security ETF 20
iShares Diversified Commodities Swap ETF 25
iShares Global Clean Energy ETF 20
Robo Global Robotics and Automation ETF 21