Archived article
Please note that tax, investment, pension and ISA rules can change and the information and any views contained in this article may now be inaccurate.
 magazine
Two key takeaways from the silicon chip market

Regular readers of this column will know of its affinity for the Philadelphia Semiconductor Index, known as the SOX. The benchmark comprises 30 global – if primarily American – manufacturers of silicon chips and semiconductor production equipment. It can be followed for free on the internet, but it has two deeper and more abiding useful facets.
First, its 28-year history suggests it is a fair proxy for global risk appetite, since the FTSE All-World index seems to follow in its footsteps.
Second, silicon chips are a useful litmus test for the global economy, owing to their ubiquity. Semiconductors are vital to any electronic or electrical gadget of which you can think, from smartphones to smart meters, cars to telecom equipment and laptop computers to industrial robots. Shortages of chips are regularly cited by many firms right now as an example of supply chain dislocation and their inability to meet demand (cars is a particularly glaring example here).
In the context of each it is therefore intriguing to note how the SOX is trading 15% below its late-December all-time high after a sudden sharp reversal.

CHIPS WITH EVERYTHING
That sudden loss of momentum seems odd given the apparently rosy outlook for the industry. Industry bodies such as the WSTS and SIA believe global chip sales rose by more than a quarter in 2021 to reach a new all-time high of around $550 billion. They also expect a further increase of some 9% to $600 billion for 2022, still above the industry’s long-term compound annual grow rate of 8% a year.

Such optimism may explain why the SOX’s 30 constituents command an aggregate market capitalisation of $3.3 trillion (even if certain key Korean and Japanese players do not feature). That figure represents nearly seven times the firms’ forecast $472 billion in aggregate sales for 2022 and 24 times analysts’ estimates for total net earnings of $135 billion.
They are lofty multiples, whichever way you cut it. Bulls will argue they are justified by above-trend growth for the industry and expectations for increases in sales, operating profit, operating margins and net profit in 2022 and 2023, even if 2021 represented a new all-time high for those metrics.

Bears will grunt that paying premium multiples when profits and margins are already at record highs is simply looking for trouble, especially as share price upside will relying on further increases in both and any disappointments could leave valuations looking cruelly exposed. This is, after all, a highly capital-intensive industry that is highly operationally geared, so minor changes in pricing or volumes lead to much bigger percentage changes in profits, up or down.
BOOM AND BUST
In short, boom and bust are rarely far apart as the chart showing industry revenues and year-on-year sales growth back to 1980 makes clear. The glory years of 1993-95, 1999-2000, 2003-07 and 2010-11 were swiftly followed by the fallow ones of 1996, 2001, 2008-09 and 2012.
Spotting potential turning points is fiendishly hard but two datapoints may prove useful.
The first is capital investment. State-of-the-art silicon chip fabrication facilities (‘fabs’ for short) cost billions of dollars and have to run full tilt once they are up and running. Fine-tuning new supply is hard and the risk is eventually chipmakers overdo it. It may therefore concern some investors when they hear that capex is due to rise by a third in 2022, after a 44% leap in 2021, and reach a new peak of 20% of sales.
At some stage, supply is likely to catch up with demand and ease those bottlenecks, although given the long lead times involved in building a new fab that may not happen overnight.

The second possible clue comes from inventories. Inventory days across the 30 SOX members reached an eight-year high of 104 in 2020. Thankfully that figure had retreated to 96 by the end of Q3 2021 and it had done so without affecting profits (note how digesting lofty inventories hurt sales and industry earnings in 2012).
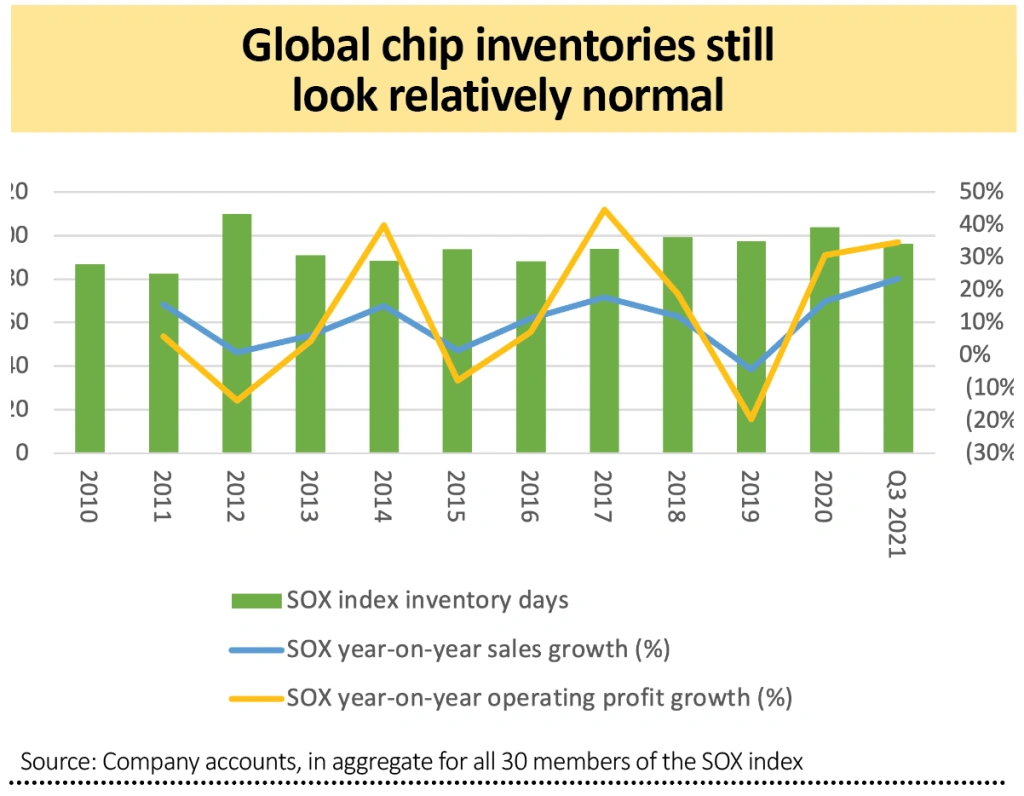
A sudden surge here would imply either demand is slowing, or supply is catching up, so this is a trend which needs careful attention. Investors in chip stocks won’t be pleased to see it but central bankers might be, as it could mean an end to some of the supply chain disruption which continues to stoke inflation.

Important information:
These articles are provided by Shares magazine which is published by AJ Bell Media, a part of AJ Bell. Shares is not written by AJ Bell.
Shares is provided for your general information and use and is not a personal recommendation to invest. It is not intended to be relied upon by you in making or not making any investment decisions. The investments referred to in these articles will not be suitable for all investors. If in doubt please seek appropriate independent financial advice.
Investors acting on the information in these articles do so at their own risk and AJ Bell Media and its staff do not accept liability for losses suffered by investors as a result of their investment decisions.
Issue contents
Editor's View
Feature
Great Ideas
- Google-owner does the splits as it smashes Q4 expectations
- Grab a great buying opportunity in Gamma Communications
- Pets At Home's new CEO is a great hire and the shares are still a buy
- Our buy call on Shell is up nearly 20% in two weeks
- Take advantage of Smithson’s stumble and top up
- Virgin Wines’ share price slump looks overdone
- This value-tilted global fund is now outperforming