Archived article
Please note that tax, investment, pension and ISA rules can change and the information and any views contained in this article may now be inaccurate.
 magazine
More tricks and tips for analysing company financial statements

The best way to test the theory around the analysis of company accounts is to put that theory into practice using a real-world example.
In the second part of our in-depth examination of food producer Cranswick (CWK) we look at the strength of its finances and how effectively it turns revenue into cash flow.
We then examine the factors which determine how much money investors might expect to make if historical growth trends are maintained.
BALANCE SHEET STRENGTH
As a reminder there are two types of financial risk that investors should monitor closely, liquidity and solvency. Liquidity risk refers to short term financing of day to day operations while solvency risk is more about long term viability.
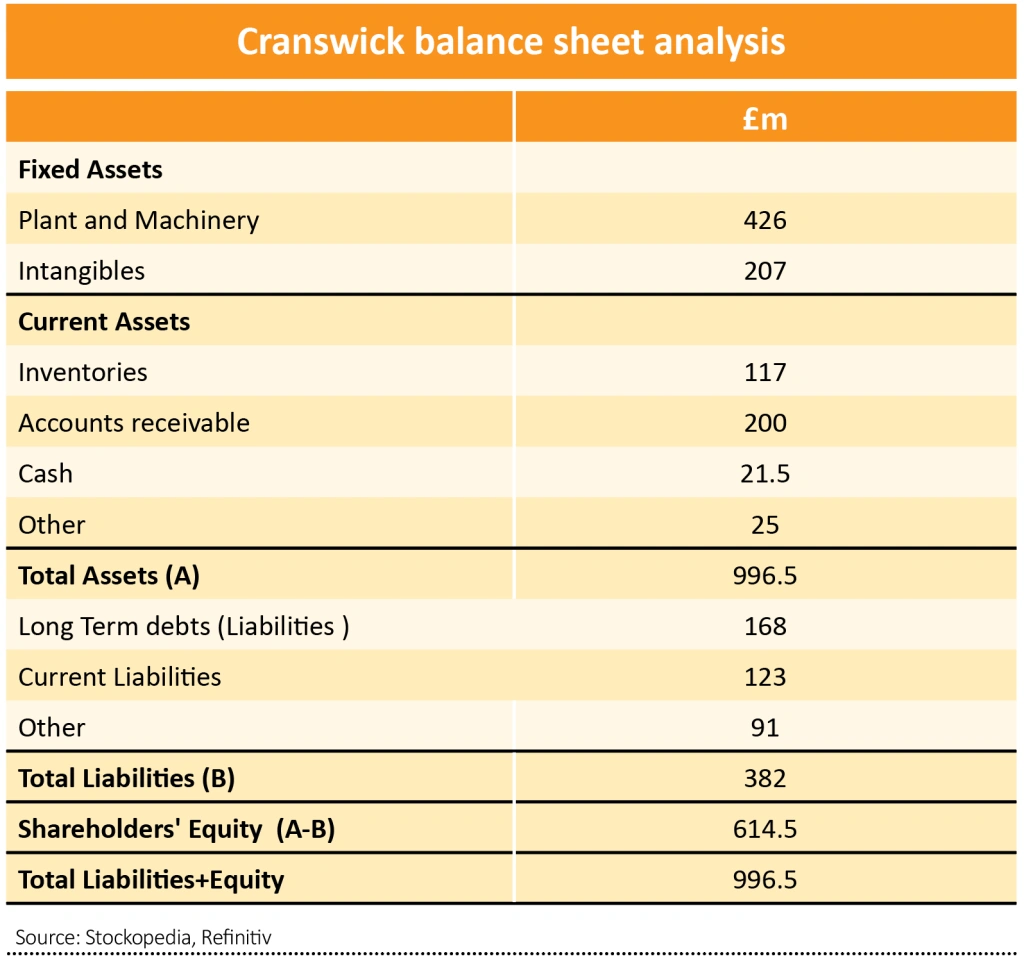
Looking first at liquidity risk, the tables show that Cranswick’s current assets easily cover current liabilities, indicating a current ratio of 1.7 times.
The more stringent quick ratio, showing the company’s ability to pay its current liabilities without needing to sell inventory, indicates it has the necessary short-term cash and equivalents with a ratio of 1.
In addition, Cranswick has a £200 million unsecured credit facility with £100 million of headroom which runs until November 2023. Banks always prefer to lend against collateral (assets) to protect themselves against potential loss.
So, when you see situations where banks are willing to provide substantial amounts of unsecured loans you can be assured that the bank isn’t worried about the creditworthiness of the company.
Looking at the solvency risk, the tables show that Cranswick has a low debt to equity ratio of 27% (debt of £168 million and equity of £615 million).
Equity finances 62% of the total assets of the business, which signals a healthy position.
We have highlighted before that accounts only provide a snap-shot of the business and therefore looking at historical trends is more informative. In this light, Cranswick has historically run its business with low financial gearing.
Net debt increased in 2020 as a result of one-off items; the company recognized lease liabilities of £66 million under new accounting rules; it acquired Continental foods supplier Katsouris Brothers for £69 million; the company also invested heavily in its infrastructure and added £97 million to the asset base.
Cranswick generated £155.3 million of EBITDA (earnings before interest, taxes, depreciation, and amortisation) in 2020 while net debt was £147 million, resulting in a net debt to EBITDA ratio of 0.95 times.
This a low leverage ratio and not a concern for lenders or shareholders. Ratios under three are considered investment grade which means the loans are unlikely to go bad.
The company has a defined pension scheme which has a small £7 million surplus, which means there is no need to adjust the net debt figure.
CASH FLOW MANAGEMENT
The long-term trend in cash management shows the company has been taking longer to convert inventory into cash, from 20 days to 30 days. It has also taken longer to collect receivables (outstanding invoices) which have increased from 34 days to 44 days.
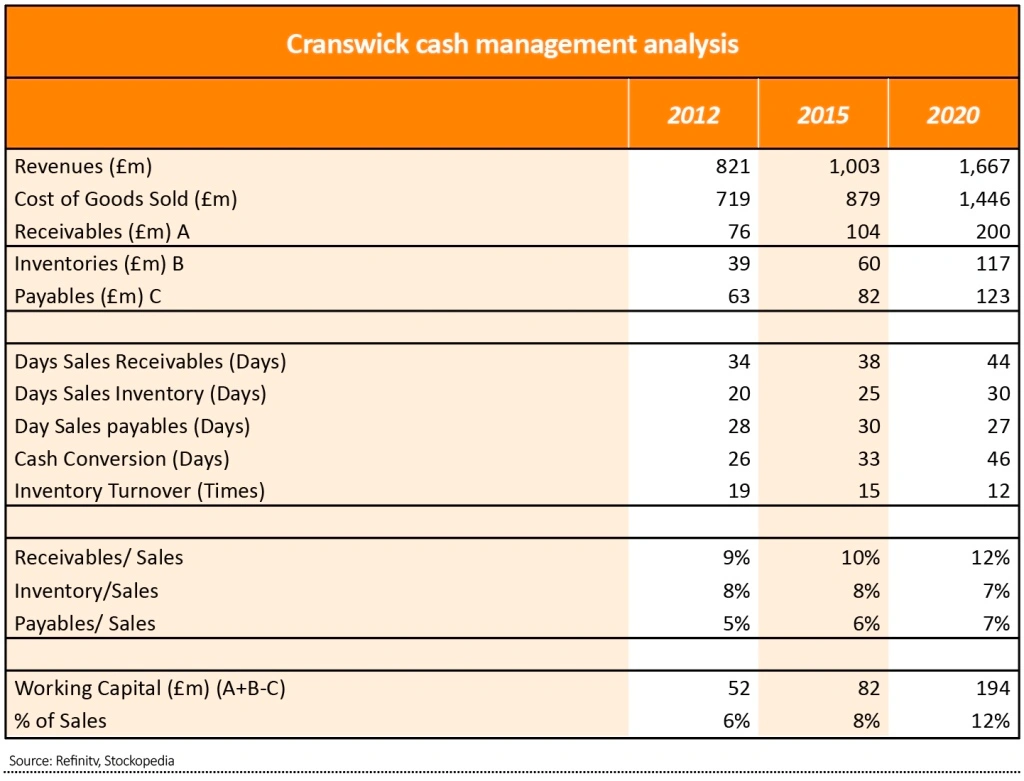
At the same time payment terms to suppliers has remained stable around 28 days. This means the cash conversion cycle has widened out and working capital as a proportion of revenue has doubled to 12% (£194 million).
One possible explanation is that supermarkets, which represent the largest channel for Cranswick have been leveraging their scale advantage and pricing power to delay payments.
SHAREHOLDER RETURNS ARE LINKED TO PROFITS GROWTH
As a reminder, shareholder returns are comprised of dividends and capital gains (rising share prices). Capital gains are driven by future profit and cash flow. This means over long periods share prices follow profits.
Over the last 50 years earnings per share for the UK stock market have grown by roughly 6% a year.
Investors can easily get access to this profit growth by purchasing a tracker or exchange traded fund (ETF) very cheaply.
Therefore, for Cranswick to make sense as a long term investment we should expect its earnings to grow faster than the market’s.
BEING ROUGHLY RIGHT
As Warren Buffett said, it’s better to be roughly right rather than precisely wrong. Because the future is unknowable, it is better trying to figure out what is probable rather than making an explicit forecast.
As we highlighted last week, Cranswick has grown pre-tax profit at a CAGR (compound annual growth rate) of 17% a year and dividends at 10% a year over the last 30 years.
However, over the last 10 years the rate of growth has slowed to 8.9% a year. As companies get larger, their growth rate tends to fall.
According to Sharepad data, analysts expect pre-tax profit growth of 25% over the next three years which equates to a CAGR of 7.7% a year. Dividends are expected to grow 7.2% a year.
On balance, the evidence suggests that Cranswick is capable of growing earnings faster than the market.
As a proxy for calculating future total return we add profit growth to the dividend yield (7.7%+1.97%) which gives a value of 9.7%. Remember things may play out very differently in the future for a variety of reasons that we failed to predict.
CAVEATS
We are making an explicit assumption that the multiple which investors are willing to pay for future profits remains roughly unchanged. Predicting future multiples is fraught with difficulty and is unknowable.

In this context it is wise to remember Isaac Newton’s famous quote, ‘I can calculate the movement of stars, but not the madness of men’.
In February 2021 Cranswick shares traded on 18.4 times next year’s earnings according to Stockopedia data, which was at the lower end of the range over the previous five years. (High 28.9, low 16.6)
This at least provides some comfort that the rating is nearer the bottom end of the range rather than the top.
Each investor must weigh their individual risk appetite against the potential rewards on offer before coming to a decision. Lastly, remember that building a diversified portfolio is just as important as single stock analysis.
Important information:
These articles are provided by Shares magazine which is published by AJ Bell Media, a part of AJ Bell. Shares is not written by AJ Bell.
Shares is provided for your general information and use and is not a personal recommendation to invest. It is not intended to be relied upon by you in making or not making any investment decisions. The investments referred to in these articles will not be suitable for all investors. If in doubt please seek appropriate independent financial advice.
Investors acting on the information in these articles do so at their own risk and AJ Bell Media and its staff do not accept liability for losses suffered by investors as a result of their investment decisions.


