Archived article
Please note that tax, investment, pension and ISA rules can change and the information and any views contained in this article may now be inaccurate.
 magazine
Understanding what really represents a ‘strong’ balance sheet

Following on from our two-part look at the income statement we now focus on the balance sheet, again in two parts.
Many companies state they have a ‘strong’ balance sheet, almost hoping that shareholders will take it as read and move on. In this article we will explore the factors that actually determine balance sheet strength and look at the financial consequences.
What are Assets and Liabilities?
Assets are what a company owns, and liabilities are what a company owes. In other words, assets represent value to a company while liabilities are obligations and detract from asset value.
Long-term assets, also called fixed assets include physical assets such as land, plant and equipment. Short-term assets include inventories, cash on deposit and debtors, which are outstanding invoices, representing money owed to a company.
Accounting convention defines short term as a period under a year.
These days intangible assets often represent a large proportion of fixed assets and include patents, copyrights, brands, customer relationships and proprietary knowhow.
Tangible assets are easier to account for than intangible assets because they have a finite life and a market resale value while intangible assets can be considered indefinite or definite and are harder to pin a value upon.
Fixed assets are purchased with cash or borrowed money and then depreciated over their estimated useful lives.
Depreciation is a non-cash expense which goes through the profit and loss account.
Accumulated depreciation reduces asset values over time and therefore the value of fixed assets is effectively gross asset value minus accumulated depreciation.
Intangibles
Intangible assets are treated differently, costs associated with acquiring patents or spending on advertising are expensed through the profit and loss account when they occur.
But the value of these assets doesn’t always appear on the balance sheet.
If a company can associate specific development costs with expected future cash flows, then those costs are capitalised and appear on the balance sheet.
They are then amortised over their expected useful life. Software companies often capitalise rather than expense development costs.
Goodwill
While goodwill is also an intangible asset it only appears on the balance sheet in relation to past acquisitions and represents the premium paid over book value of the acquired assets.
Unlike intangible assets like patents and licenses which can be sold separately, goodwill cannot be sold or purchased independently of the business and has an indefinite useful life.
However, goodwill can be written off when a company recognises that the premium it paid was a mistake. Some of the biggest losses in history relate to writing off of goodwill.
For example, when Time Warner purchased AOL for $165 billion in 2001 it was the largest corporate transaction up until that time. A year later it wrote-off the attributable goodwill resulting in a net loss of $99 billion. This was a non-cash charge but did result in a fall in asset value.
Liabilities
On the other side of the balance sheet are a company’s short and long-term obligations.
Long-term liabilities include multi-year borrowing facilities while short-term items include bills that the company hasn’t settled yet, referred to as creditors.
You might have wondered why shareholders’ equity appears on the liability side of the balance sheet and it’s because it represents the amount which in theory would be returned to shareholders if a company’s assets were liquidated and its debts repaid.
Every balance sheet must balance which means the total value of a company’s assets must equal the value of its liabilities plus shareholder’s equity.
Solvency and Liquidity
Now we have discussed the main items on the balance sheet we can start to define strong and weak balance sheets.
There are two categories of risk, the first is short term in nature and the second is longer term. Not having enough liquidity to run current operations and service debts is called liquidity risk.
The second category is known as solvency risk and concerns the ability of a company to meet its long-term obligations.
When a company is solvent, technically it means the value of assets is greater than liabilities. In other words, it has a positive ‘net worth’ or book value.
It implies that a company can meet all its long-term obligations even if it had to liquidate all its assets.
Liquidity on the other hand refers to short term financing requirements. Even the most solvent company can run into liquidity problems if it doesn’t manage its short-term cash flows properly.
One high profile casualty of short-term cash mismanagement is Bargain Booze and Wine Rack owner Conviviality which went to the wall because it couldn’t pay its £30 million VAT bill.
When a company can pay off its current liabilities with its current assets it has adequate liquidity to fund current operations and service debts.
There are specific ratios that investors use to help determine adequate or safe levels of solvency and liquidity.
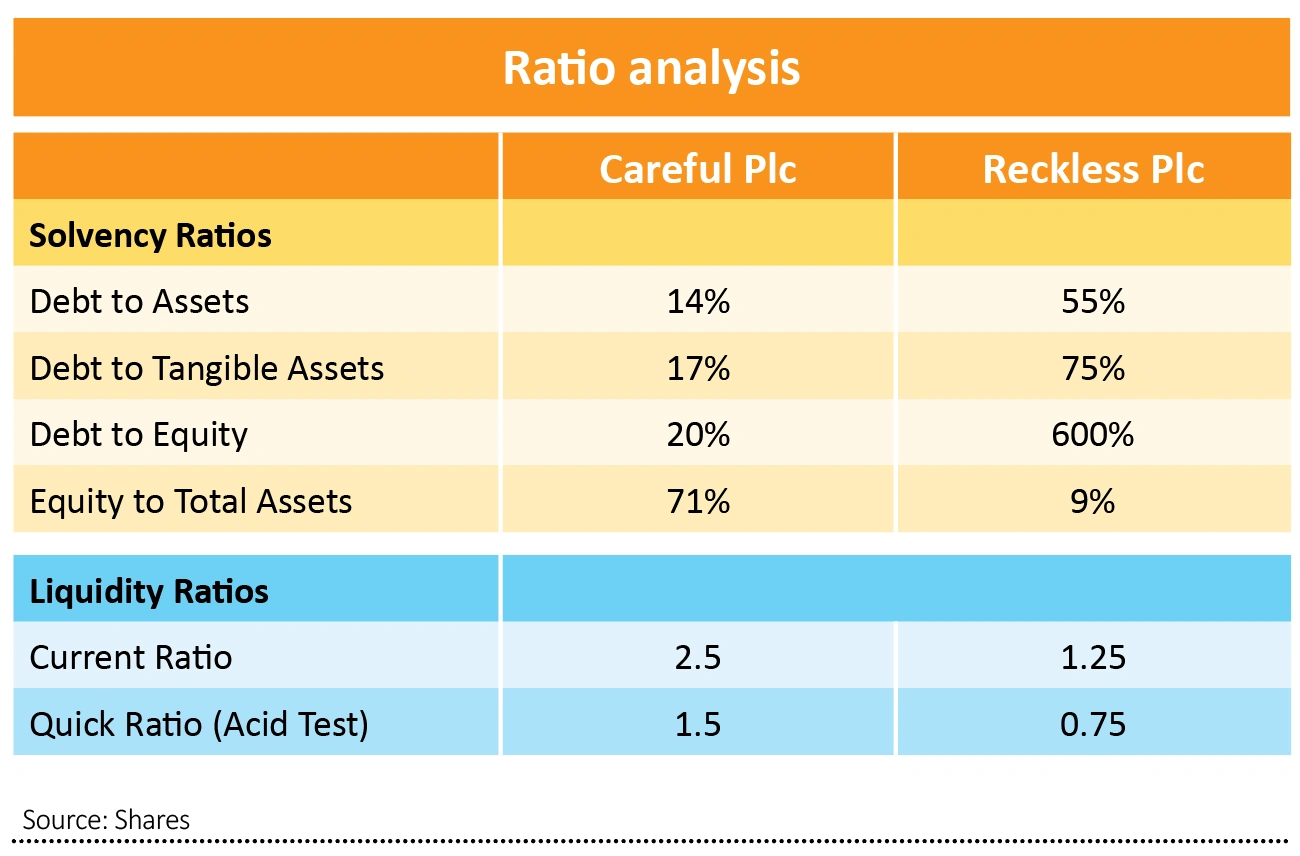
Solvency ratios include debt-to assets, also called the leverage ratio, debt-to-equity, sometimes called the gearing ratio, and interest coverage.
Commonly used liquidity ratios are the current ratio and quick ratio, also known as the acid test, because it has stricter parameters.
Next week we look further at balance sheet strength by incorporating cash flow measures including EBITDA (earnings before interest, taxes, depreciation and amortisation).
We also look for more red flags by analysing working capital trends and how long it takes a company to collect cash.
What a strong balance sheet really looks like
Fictitious company, Careful Plc, has current assets of £30 million and fixed assets of £40 million of which £10 million are intangible.

Long-term debts are £10 million, and shareholders’ equity is £50 million.
We could say with some confidence that Careful plc possess a strong balance sheet. Let’s examine why.
The debt to assets ratio, also called the leverage ratio measures the proportion of assets that are financed by debt. Banks and creditors use this ratio to determine the amount of debt a company can afford.
Almost without exception, higher leverage leads to higher risks of a company failing to meet its long-term obligations.
This doesn’t mean a company is in immediate trouble, but without remedial actions poor solvency measures are more likely to lead to bankruptcy.
Industries with more dependable cash flows like utility companies can sustain higher levels of leverage, so as ever, business context is important.
Careful Plc has a debt to assets ratio of 10/70 or 14%, a very comfortable position. This means that 86% of its assets are financed by equity.
Some value investors prefer to focus on tangible assets because they consider tangible value more certain and also banks generally only lend against tangible assets.
On this measure, debt to tangible assets increases to 10/30 or 30% which is still comfortable.
Looking at the proportion of equity to debt financing, the gearing ratio is a very modest 10/50 or 20%. This means that shareholders’ equity covers debt five times.
Leverage and gearing ratios below 50% are considered healthy while values above 75% are riskier. Also relevant is the amount of equity in relation to total assets. A value below 30% is considered risky.
Looking at liquidity the current ratio gives a good picture of a company’s ability to meet short term obligations. It is defined as current assets divided by current liabilities. Careful Plc has a ratio of 2.5 which is very comfortable.
A ratio below 1.5 is considered tight and below one could indicate cash problems. As we have mentioned before in this series, looking at the trend is more informative than single years.
The quick ratio shows a company’s ability to pay its current liabilities without needing to sell inventory and is therefore a more conservative measurement of liquidity.
Careful Plc is in a strong position to pay all its short-term debts while Reckless Plc would struggle to do so without selling inventory.
Reckless Plc is in a precarious position financially because it has too little equity and too much debt financing its assets. Debt to equity of 600% is considered dangerously geared.

Important information:
These articles are provided by Shares magazine which is published by AJ Bell Media, a part of AJ Bell. Shares is not written by AJ Bell.
Shares is provided for your general information and use and is not a personal recommendation to invest. It is not intended to be relied upon by you in making or not making any investment decisions. The investments referred to in these articles will not be suitable for all investors. If in doubt please seek appropriate independent financial advice.
Investors acting on the information in these articles do so at their own risk and AJ Bell Media and its staff do not accept liability for losses suffered by investors as a result of their investment decisions.
Issue contents
Editor's View
Feature
First-time Investor
Great Ideas
- Act fast with Brunner to secure very cheap access to good stocks
- Stick with Yamana Gold despite falling share price
- Don't be tempted to take profit on Treatt following recent share price spike
- Good strategic process is helping to drive up shares in PZ Cussons
- Ford shares electrified and there could be more to come
- There is so much to like about ASOS as an investment
Investment Trusts
Money Matters
News
- Surge in amateur day traders suggests final stages of market bubble
- Terry Smith denies overexposure to highly valued tech firms
- Market excitement is building over electric vehicle growth
- Rolls-Royce under pressure after new setback
- Asian stock markets have raced ahead so far in 2021
- Companies may tap investors again for cash to survive the crisis