Archived article
Please note that tax, investment, pension and ISA rules can change and the information and any views contained in this article may now be inaccurate.
 magazine
Secrets of the income statement revealed

To really understand a company you need to go back to the fundamentals of its performance. This is the first in a series of articles on company financial statements where we delve into the numbers and highlight what is important and how to get the most out of the accounts.
First, we look at the profit and loss statement in two parts.
THINK LONG TERM
Investing should be a long-term endeavour, and if you start early enough you will have a long period in front of you in which to grow your portfolio over the years.
This puts the private investor at an advantage compared with institutional investors who get judged on quarterly and monthly performance.
The focus should be trying to figure out what a company might look like in a few years’ time. After all, shareholders are owners of the equity of a company and have an economic claim on all future net cash flows after interest payments and taxes have been deducted.
WHY DO COMPANIES HAVE DIFFERENT YEAR-END DATES?
It might seem obvious but it’s worth pointing out that the report and accounts are a ‘point-in-time snap-shot’ of a business.
Management and their accountants are free to choose the year-end date and often choose a date that shows a business in its ‘best light’.
For example, airlines tend to choose a winter or spring year-end because they receive cash for holidays up front and people tend to book their summer holidays in the winter.
For seasonal businesses, it’s also a matter of practicality because it would be difficult and confusing to produce year end accounts and audit them during the busiest time of the year.
For example, most retailers close their year between the end of January and April, after the busiest trading period over Christmas.
FOCUS ON THE TRENDS
A single set of accounts won’t tell you much about the direction of travel for the business, so it’s far more fruitful to look at how sales and profits have developed over a longer period. We will explain these terms later.
Similarly, companies don’t operate in a vacuum, so it’s also worth comparing how competitors in the same business have performed.
You are aiming to understand how a business makes money and judge how reliable profits are as well as estimate their future growth. Profit growth is far more important than revenue growth.
Double-digit revenue growth may show there is demand for the product or service which is a good sign, but it’s of no use if those extra revenues don’t at some point end up in higher profits.
Competition is also important to address because it’s probable that other companies are chasing the same growth opportunities and that will impact future profitability. Winners and losers are a fact of business life.
Sometimes there can be a justifiable lag between revenue growth and profits. For example, online retailer Ocado (OCDO) has been pursuing growth in order to build scale and exploit its first mover advantage.
One final point to consider is that the income, cash flow and balance sheet statements should be read in conjunction with each other.
For example, profit should always be compared with cash generated by the business. The higher the cash element the better. That’s because from an accounting perspective cash is cash, while profit can be whatever management wants.
Let’s run through the profit and loss or income statement from clothing retailer Next (NXT) with the aid of the 10-year financial summary provided by the company and Stockopedia’s income and cash flow statements.

Revenue or sales are broadly interchangeable terms and sometimes referred to as the top line. They represent the total income generated through selling products and services or commissions earned on selling products.

For most companies like Next, accounting for revenue is straightforward but it is worth being aware of longer timing differences that can exist between a company making a sale and receiving the cash.
Industries like defence and engineering can sometimes wait a long time to collect cash and consequently require more working capital to operate and expand.
At the other extreme are subscription type businesses like Relx (RELX) or the airlines and food retailers who get paid upfront.
We will cover working capital in a future balance sheet article, but briefly it is investment in inventory and raw materials and accounts receivable (customers who haven’t paid yet) minus creditors.
It’s worth checking the notes to the accounts to understand each company’s revenue recognition policy.
Next’s online revenue has grown almost 10% a year to reach £3.1 billion while revenues from physical stores have shrunk by 2% a year to £1.9 billion reflecting a move to own fewer, out of town larger stores.
The next important line to spend some time on is gross profit which represents the added value created by the product or service. Dividing gross profit by revenue produces a gross margin percentage.
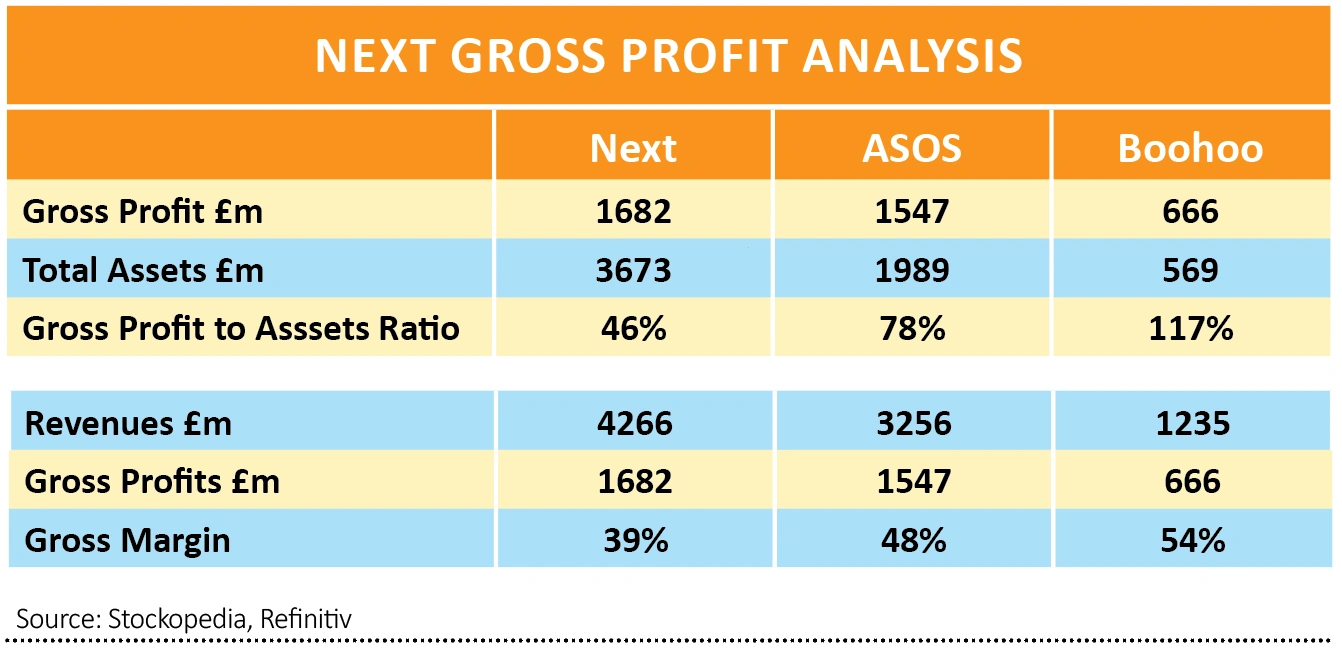
Given that Next generates most of its revenue online it is interesting to compare margins with online groups Boohoo (BOO) and ASOS (ASC).
Next generates a gross margin of 39% compared with Boohoo and ASOS which achieve 51% and 48% respectively. This may mean that the pure online retailers’ goods are perceived by customers of higher value or that the companies squeeze more costs out of their suppliers.
Where possible these numbers should also be put into a wider industry context and here all three companies have higher than average gross margins, implying more pricing power.
The gross profit to total assets ratio was first identified by Robert Novy-Marx in an academic paper which found that more profitable companies on this measure produced higher share returns than lower profitability firms.
Next has a ratio of 45% which compares to Boohoo and ASOS on 117% and 78% respectively, demonstrating their ‘asset light’ models compared with Next which still has a large retail estate. A number above 40% is considered very good
The next most important line in the income statement is the operating profit line, sometimes called earnings before interest and taxes (EBIT).
It is what is left after deducting payroll, marketing and general administration expenses from revenues. Depreciation and amortisation are also deducted where a company has fixed assets. Depreciation reflects the ‘wearing-out’ of the asset base.
Most assets have a fixed life and a common policy is to write assets down over their useful life. The useful life assumptions can be found in the notes to the accounts. Companies in the same industry tend to use similar assumptions, so differences are worth investigating further.
When comparing companies in the same sector it is often useful to use the operating profit margin which is operating profit as a percentage of revenues. Again, looking at the trends rather than single years gives a better perspective.
Operating margin is a good measure for comparison because it reflects earnings before interest and taxes are deducted. These latter items may differ widely between different companies.
For example, if one company employs debt financing and another doesn’t. Companies may also have differing tax rates depending on where they operate.
Next has averaged relatively high 20% operating margins compared with Boohoo and ASOS which have averaged around 7% and 4% respectively.
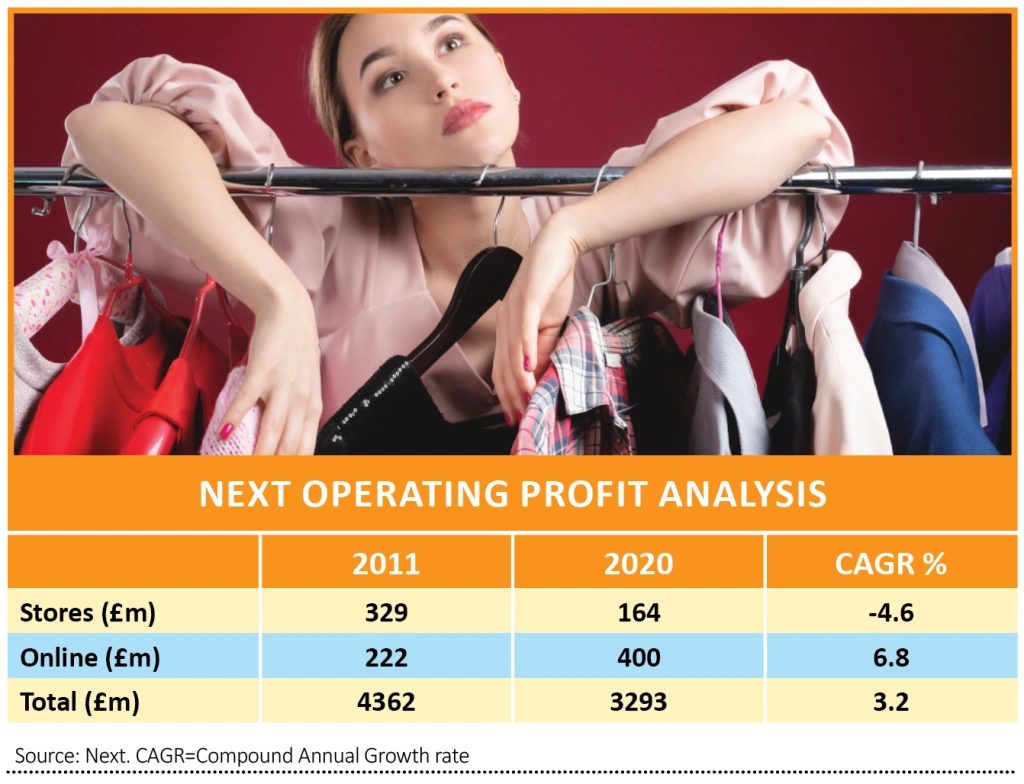
The impact from the shift to online trading is more clearly seen at the profit line with the retail estate seeing profit halve to £164 million while online profit has grown by 6.8% a year to reach £400 million.
Next week we will tackle the bottom half of the income statement including interest, taxes, profits and earnings per share as well as calculating shareholder value.

Important information:
These articles are provided by Shares magazine which is published by AJ Bell Media, a part of AJ Bell. Shares is not written by AJ Bell.
Shares is provided for your general information and use and is not a personal recommendation to invest. It is not intended to be relied upon by you in making or not making any investment decisions. The investments referred to in these articles will not be suitable for all investors. If in doubt please seek appropriate independent financial advice.
Investors acting on the information in these articles do so at their own risk and AJ Bell Media and its staff do not accept liability for losses suffered by investors as a result of their investment decisions.
Issue contents
Editor's View
First-time Investor
Great Ideas
- Alibaba faces baptism of fire at start of 2021
- IP Group still offers upside as it eyes further realisations
- Play a regional recovery with BlackRock Latin American
- Buy Sainsbury's now before the shares surge
- Gamma run could speed up if it can nick a bit of Twilio’s limelight
- Recent acquisition provides growth and security for Gresham House


