Archived article
Please note that tax, investment, pension and ISA rules can change and the information and any views contained in this article may now be inaccurate.
 magazine
What can you learn from the correlation matrix in a portfolio X-ray report?

Could you explain the correlation matrix on a portfolio X-ray analysis tool? It has no meaning for me, so I am unaware if it provides any useful information.
Charles Gibbs
Senior reporter, Martin Gamble replies
Imagine the shares and funds in your portfolio as magnets, attracting and repelling other magnets.
Correlation is simply the strength of the attraction, with positively correlated shares moving in lockstep and negatively correlated ones moving in opposite directions.
The numbers in the boxes are a mathematical measure of the strength of the attraction or correlation between pairs of assets in your portfolio.
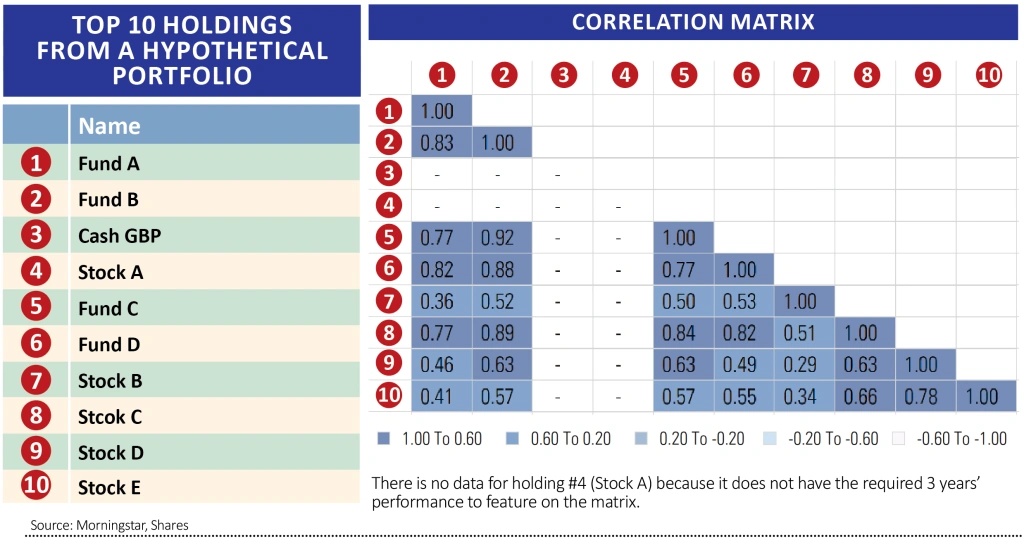
A +1.0 reading indicates they move in the same direction with perfect synchronisation and -1.0 means they have perfect synchronisation in opposite directions. A value of zero shows there is no relationship between the two assets.
Pairs of assets with values less than 0.5 are considered uncorrelated, like magnets which neither attract nor repel.
The matrix is based on three years’ performance. An important point to remember is that correlation isn’t equivalent to causation. If a different three-year window was used the results wouldn’t necessarily be the same.
It’s also worth noting that the number doesn’t have anything to do with relative performance between the two assets, it just tells you how much they ‘bob and weave’ together or don’t.
The role of diversification is very important in the context of risk management because the more you have of it the less the portfolio will move around. It’s also worth remembering that if the value of your portfolio falls, it needs to rise more in percentage terms to get back to where it was due to the base effect.
For example, a loss of 10% requires the portfolio to go up by 11.1% to fully recover the loss. A more extreme example is where a 50% gain is required to recapture a 33% loss.
If you can reduce the ups and downs of the portfolio, it will likely perform better as well as giving you a better night’s sleep.
In a perfect world it would be great to have some assets which are negatively correlated to each other because the portfolio would then be relatively stable. In practice you won’t often see two shares which are negatively correlated, because all shares tend to move together.
However, greater diversification can be achieved by spreading your holdings across sectors with different sensitivities to the economy, for example utilities and supermarkets will behave differently to the very cyclical sectors like banks and construction firms.
Lastly, holding different types of assets like bonds or bond funds will increase diversification and provide stability to the portfolio. Bonds can provide safety when share prices fall.
DO YOU HAVE ANY QUESTIONS ABOUT MARKETS AND INVESTING?
Let us know if we can help explain how something works or any other question relating to markets and investing. We’ll do our best to answer your question in a future edition of Shares.
Email editorial@sharesmagazine.co.uk with ‘Reader question’ in the subject line.
Please note, we only provide information and we do not provide financial advice. We cannot comment on individual stocks, bonds, investment trusts, ETFs or funds. If you’re unsure please consult a suitably qualified financial adviser.
Important information:
These articles are provided by Shares magazine which is published by AJ Bell Media, a part of AJ Bell. Shares is not written by AJ Bell.
Shares is provided for your general information and use and is not a personal recommendation to invest. It is not intended to be relied upon by you in making or not making any investment decisions. The investments referred to in these articles will not be suitable for all investors. If in doubt please seek appropriate independent financial advice.
Investors acting on the information in these articles do so at their own risk and AJ Bell Media and its staff do not accept liability for losses suffered by investors as a result of their investment decisions.
Issue contents
Editor's View
Feature
First-time Investor
Great Ideas
- Market share gains to fuel Motorpoint
- Analyst upgrades Luceco forecasts for the second time in as many months
- Play the healthcare boom via ‘best in class’ UDG
- QinetiQ growth strategy progressing despite challenges
- Buy care home investor Target Healthcare for a 6% yield
- Hipgnosis is cashed up and ready to buy more songs
- Ocado has a monumental growth opportunity
Investment Trusts
Money Matters
News
- US earnings season unlikely to add clarity to full year outlook
- Red hot Tesla could put huge stock offering on the table
- Fevertree shares fall on margin concerns
- Global company debt could jump by $1 trillion in 2020
- Halma’s record profit streak set to end
- B&M shares hit new record high as analysts upgrade forecasts