Archived article
Please note that tax, investment, pension and ISA rules can change and the information and any views contained in this article may now be inaccurate.
 magazine
Good portfolio planning matters more than good luck

The twentieth-century American journalist Edward R. Murrow may be best known for his ground-breaking reports from Buchenwald in 1945 and the manner in which he signed off each of his broadcasts by saying ‘Good night and good luck’.
That phrase was ultimately used in 2005 as the title of a film that depicted his battle with communism-obsessed Senator Joseph McCarthy but this column’s favourite pearl from Murrow is his comment that: ‘Anyone who isn’t confused doesn’t really understand the situation.’
In the narrow context of financial markets, this seems particularly apposite. Equity markets switched from blind panic in late February and early March to what felt like exuberance by mid-June.
Sentiment has therefore switched from deep pessimism about Covid-19 and its implications, to optimism that the damage to health and wealth may not be too long-lasting. The truth may well lie somewhere in between, so late June’s slide in share prices could be seen as sensible, especially as doubts about the health of the global population (let alone its economy) creep in once more.
Given the uncertainty over the pandemic and the range of possible outcomes, this may seem sensible to many investors, and the range of emotions can be tracked, albeit in a rather shorthand form, by the VIX index.
PANIC TO OPTIMISM AND BACK
The so-called ‘fear index’, which can be tracked for free via the internet, measures expected future volatility in the US equity market (there used to be a UK equivalent but it appears to have been discontinued in summer 2019, at least according to this column’s regular data provider).
The VIX was launched in 1990 and it has averaged a reading of 19.4 over its 30-year history. The lowest reading ever was 9.1 in November 2017 and the VIX set a new high this year of 82.7 in March, when it surpassed the 80.9 peak seen in November 2008 as the Great Financial Crisis reached its zenith.
A long-term chart shows that the VIX tends to peak as share prices bottom and vice-versa. This makes sense in that valuations will be at their cheapest (and therefore most rewarding) during panics and sentiment is washed out, while valuations will be at their highest (and therefore least rewarding, at least over the long-term) when animal spirits are rampant and confidence is high.
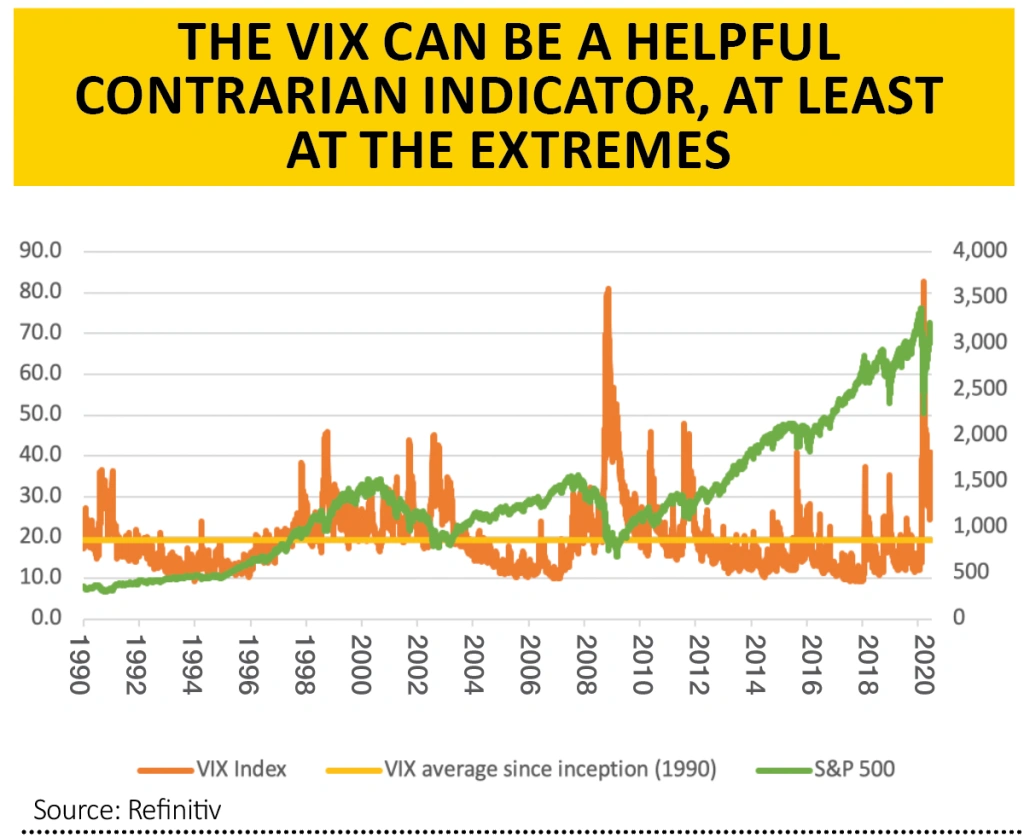
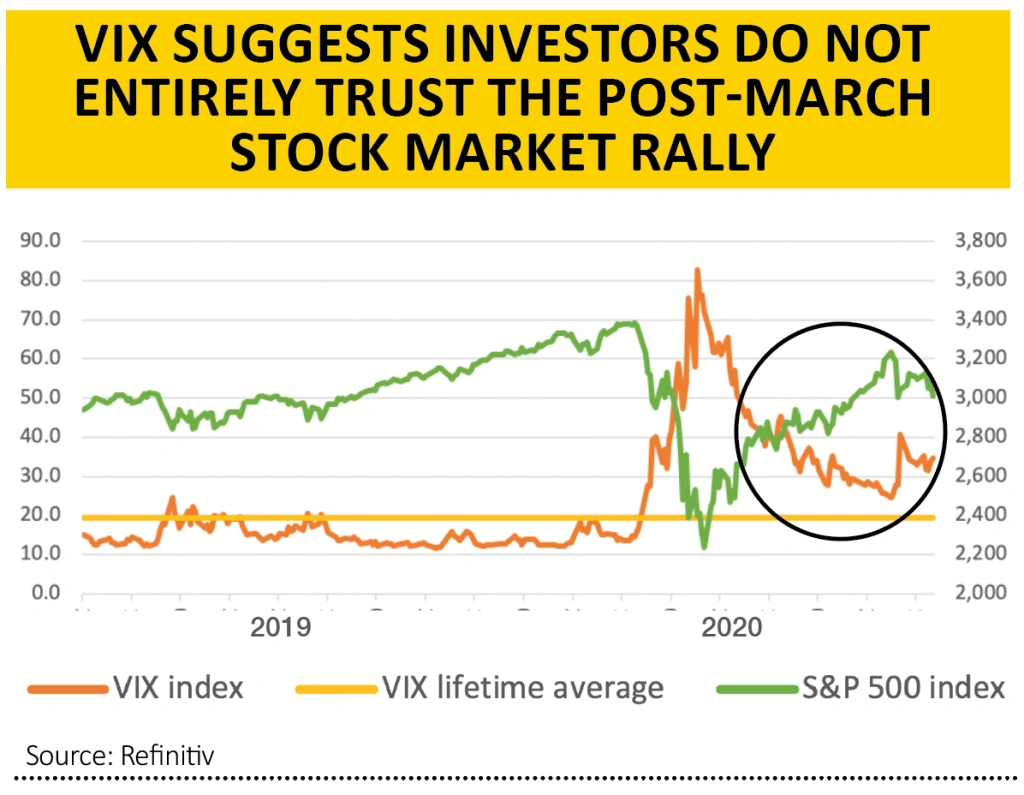
What is eye-catching about the rally in the S&P 500 US equity benchmark since March is how the VIX has not once even gone back to that lifetime average of 19.4, let alone below it.
This would suggest that conviction levels may not be high, given the possible reliance of the advance upon largesse from the US Federal Reserve which may now be drying up, at least temporarily.
It also suggests that investors do not entirely trust the rally since March and are at the very least preparing for more lumps and bumps along the way as policymakers and the actions of the wider population try to strike the right balance between physical and financial health in their responses to the ongoing pandemic.
MIXED MESSAGES
A little bit of Mr Murrow’s good luck therefore may not go amiss but this leaves investors with a dilemma, not least because relying on fortune is no sort of strategy at all.
Some will be tempted to see the VIX’s elevated levels as a chance to buy on the dips and make the most of the prevailing cautious sentiment.
Others will take the view that no-one truly knows what is coming next – a vaccine, a second wave, an inflationary economic recovery, a deflationary economic shock or even stagflation. The VIX’s refusal to go anywhere near its average points to great uncertainty and the potential dangers that could come with taking a strong view on any of the possible scenarios that may ensue.
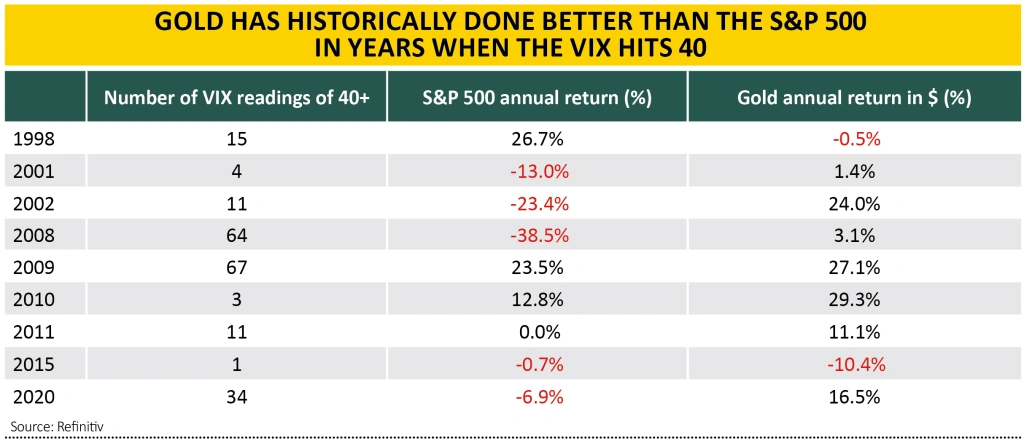
VIX readings over 40 (just more than twice the long-run average) are pretty rare – the ‘fear index’ has only got there in nine years out of 30 and for just over 200 days in total (barely 2.5% of the time).
Some of the annual samples are very limited but across those nine years, the S&P 500 has recorded a gain three times (1998, 2009 and 2010), done nothing twice (2011 and 2015) and fallen on the other four occasions (2001, 2002, 2008 and 2020 to date).
That mixed bag again speaks against taking too definitive a view amidst the current uncertainty and perhaps in favour of a diversified portfolio that is designed to cater for, protect against and hopefully benefit from multiple possible outcomes. For example, the S&P 500’s record in those nine years when the VIX hits 40 is pretty mixed but gold can point to seven gains and just two losses so the precious metal could be considered as a possible diversifier, especially if investors fear a sustained economic downturn.
Admittedly, an argument in favour of portfolio diversification is hardly new but in its defence this column will reach for a third and final quote from Ed Murrow, by way of conclusion:
‘The obscure we see eventually. The completely obvious, it seems, takes longer.’

Important information:
These articles are provided by Shares magazine which is published by AJ Bell Media, a part of AJ Bell. Shares is not written by AJ Bell.
Shares is provided for your general information and use and is not a personal recommendation to invest. It is not intended to be relied upon by you in making or not making any investment decisions. The investments referred to in these articles will not be suitable for all investors. If in doubt please seek appropriate independent financial advice.
Investors acting on the information in these articles do so at their own risk and AJ Bell Media and its staff do not accept liability for losses suffered by investors as a result of their investment decisions.


