Archived article
Please note that tax, investment, pension and ISA rules can change and the information and any views contained in this article may now be inaccurate.
 magazine
US equities may need to prove their independence from the Fed

America’s S&P 500 stock market index is down just 5% so far in 2020 and it is up 5% compared to its level of a year ago. Given everything that the world continues to throw at it – COVID-19, a deep economic downturn, social unrest, ongoing trade tensions with China and apparent chaos in the White House – this seems nothing short of remarkable.
There are several possible explanations, including the powerful role played by Facebook, Alphabet, Amazon, Apple, Netflix and Microsoft, in terms of their market caps (nearly a quarter of the S&P 500 on their own) and earnings; tentative signs of recovery in economic indicators such as weekly jobless claims, retail sales and purchasing managers’ indices; substantial support for the economy in the form of fiscal stimulus from Congress and equally aggressive monetary policy from the US Federal Reserve.
The latest test of technology’s ability to support the US equity market will come when that sextet reports its next set of quarterly earnings in late July. The economic data will continue to roll in and further improvement is needed here, as few if any indicators are within 10% of their all-time peaks, unlike the S&P 500. Meanwhile, there is talk of a further $1 trillion spending plan by the Trump administration.
But it is a subtle shift at the Fed which may be the most important trend right now.
Cup runs dry
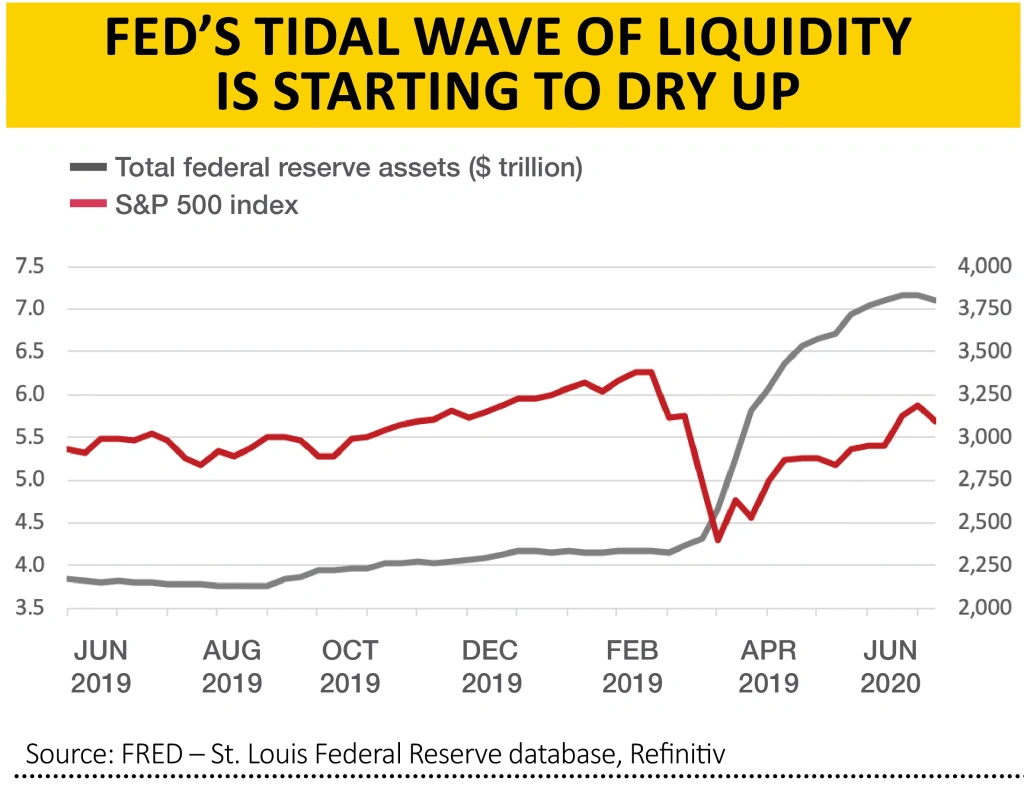
The S&P 500 index bottomed at 2,237 on the very day that Federal Reserve chair Jay Powell further expanded the size and range of quantitative easing (QE) to include not just Treasury bonds and asset and mortgage-backed securities but corporate bonds, too.
Since March, the Fed’s balance sheet has expanded by some $2.5 trillion and share prices have ripped higher.
However the rate at which the Fed’s balance sheet has expanded began to slow in May and last week (to 17 June) it shrank for the first time since February. The decline was only small – some $74 billion – but that was a far cry from the huge weekly increases of the spring.
Three tests
This will be a key test for the theory that Fed liquidity is the main reason why US equities are doing so well in the face of so many challenges.
The S&P 500 looks to be pausing for breath so, if that theory is right, it will fall to fiscal stimulus, momentum in macro data and above all corporate earnings and cash flow to take up any slack.
Investors can use three indicators as a guide to how the market is seeing the interaction between those three trends and US equity valuations.

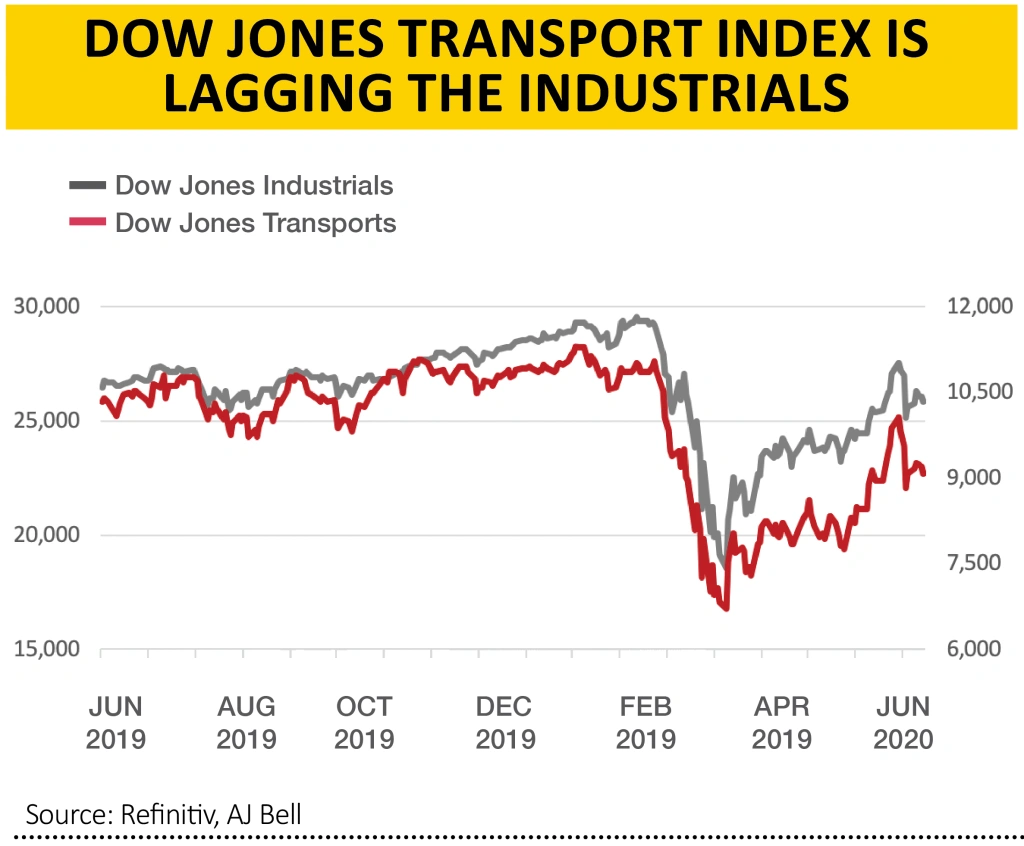
The first is the Dow Jones Transportation index, since Dow Theory notes that the Dow Jones Industrials (and by implication the wider US stock market) cannot get far if the transport stocks are failing to fire. The transports have lagged since 23 March, 1 January and over one year, so bulls will want to see them build up fresh steam.
The second is the Russell 2000 small cap index. Small caps tend to be more closely tied to the economic fortunes of their home market and their share prices tend to be a good guide to the level of risk appetite among investors.
The Russell has outperformed the Dow Jones’ mega caps over one year and its recent loss of momentum could be down to fears of a second wave of COVID-19 in the US as much as it is to the Fed stepping back.

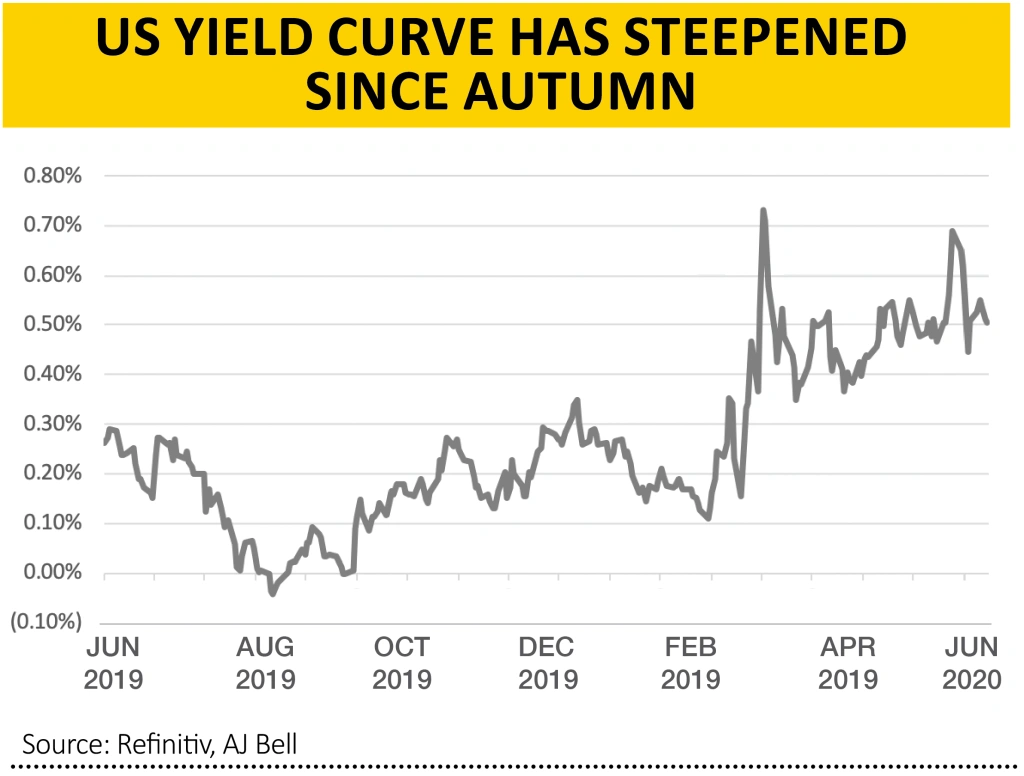
Finally, we come to the yield curve, the difference in yield between the two-year and 10-year US Government Treasury bonds.
A steepening curve usually foretells of accelerating economic activity, and even inflation, while a flattening one is often seen as a warning of a slowdown. The yield curve has steepened, and the recent flattening may be due to fears of a second wave as much as the Fed’s move to stop adding to QE.
If the yield curve continues to steepen, that would suggest markets are thinking about inflation in the longer term, thanks to the combination of monetary and fiscal stimulus poured into the economy by the Fed and Congress.
That could be the most telling trend of all. If history is any guide (and there are admittedly no guarantees), periods of inflation mean investors need hard assets (commodities and property) and ‘value’ areas like cyclicals, financials and emerging markets. By contrast, they would need to shun bonds and ‘growth’ stocks.
In other words, do the direct opposite of what has worked for the last decade.

Important information:
These articles are provided by Shares magazine which is published by AJ Bell Media, a part of AJ Bell. Shares is not written by AJ Bell.
Shares is provided for your general information and use and is not a personal recommendation to invest. It is not intended to be relied upon by you in making or not making any investment decisions. The investments referred to in these articles will not be suitable for all investors. If in doubt please seek appropriate independent financial advice.
Investors acting on the information in these articles do so at their own risk and AJ Bell Media and its staff do not accept liability for losses suffered by investors as a result of their investment decisions.
Issue contents
Editor's View
Feature
First-time Investor
Great Ideas
- Premier Foods is in a sweet spot as it breathes new life into the business
- Lam Research is a best in class stock you need to own
- Buy Touchstone now as it gears up for a big increase in production
- Microsoft shares hit new all-time high as it sees little coronavirus impact
- Fresh pork-to-poultry supplier Cranswick continues to sizzle
- Polar Capital’s shares are up 10% since we said to buy a week ago


