Archived article
Please note that tax, investment, pension and ISA rules can change and the information and any views contained in this article may now be inaccurate.
 magazine
What can I learn from the X-ray return analysis chart?

I have a SIPP with AJ Bell. When I run an X-ray of my portfolio I have a return analysis chart that appears.
The only thing I know about it is that ideally the numbered circles should be to the right of the vertical line and above the horizontal line. Apart from that I don’t know much else. Would it be possible to have this chart explained?
Leigh Moss
Senior Reporter Martin Gamble replies: The return analysis chart provides a picture of portfolio risks and returns, and makes a comparison to an appropriate benchmark. The chart and table of holdings shown here relate to a hypothetical portfolio.
The first thing to note is the time frame on each axis, which is three years, a minimum period for measuring meaningful returns and risk.
This is because over shorter time frames there is too much ‘noise’ or random effects which can muddy the true picture.
Each company in the portfolio’s top 10 holdings is represented by a circle and number so that you can identify assets in the table below the return analysis chart.
One of the key concepts of portfolio management is something called risk adjusted returns.
A generally accepted way to measure risk is to look at the standard deviation, which simply measures how much a share or portfolio moves around. The more it moves around the higher the standard deviation and the higher the risk.
Returns alone don’t provide a rounded picture; we need to know how much risk was taken as well. The horizontal axis measures how much risk was taken to achieve the stock and portfolio returns.

The table lists the top 10 holdings in a portfolio and in this particular case we have generated a random portfolio to demonstrate how it works. The first column named ‘Assets’ lists the largest percentage holdings in the portfolio. For example Fund A represents around a third of the whole portfolio (32.44%).
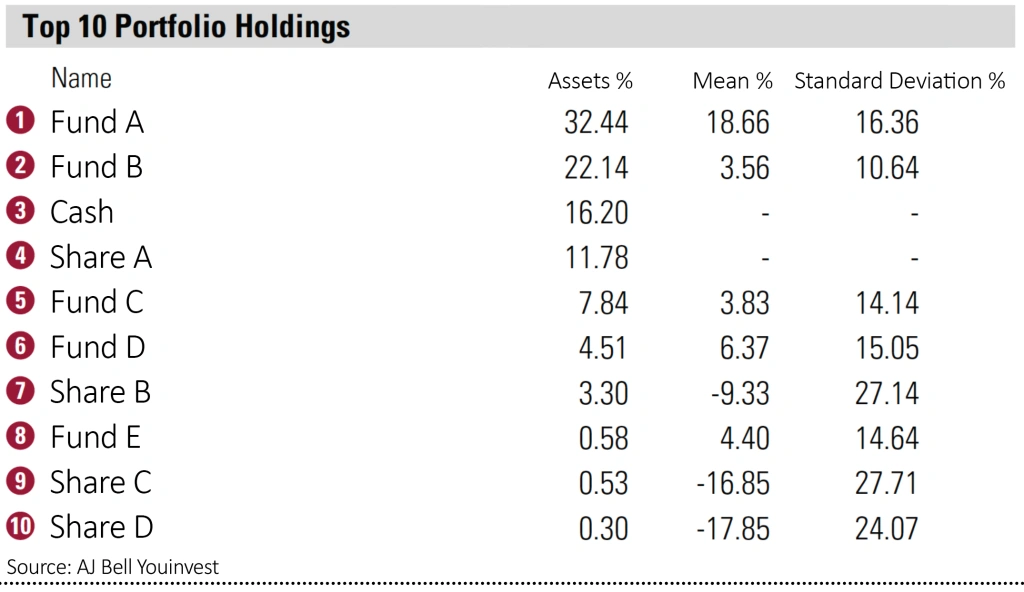
The second column tells you the percentage average annual return over the last three years while the last column shows the standard deviation, again measured as an annual three-year average. Fund A has provided a three year average return of 18.66%. Looking at the third column, the standard deviation for Fund A is 16.36%.
You can see these values in chart above by looking at circle number one, which represents Fund A.
As a general rule, assets whose return is greater than the standard deviation have provided a good risk adjusted return. Fund A fits this profile. As can be seen from the table this is not true for all the holdings.
You are correct that ideally the circles should be to the right of the vertical line and above the horizontal line. In addition, you should also be looking for your portfolio to be above and to the left of the benchmark box, which means you have a better risk adjusted return.
In other words, more return for less risk. It’s more difficult to achieve consistently good returns if some of the shares in your portfolio move around more than average, so keep an eye on shares plotting to the far right and consider if the return is worth the extra risk.
You can read more about the Portfolio X-Ray tool discussed in this article.
DO YOU HAVE ANY QUESTIONS ABOUT MARKETS AND INVESTING?
Let us know if we can help explain how something works or any other question relating to markets and investing. We’ll do our best to answer your question in a future edition of Shares.
Email editorial@sharesmagazine.co.uk with ‘Reader question’ in the subject line.
Please note, we only provide information and we do not provide financial advice. We cannot comment on individual stocks, bonds, investment trusts, ETFs or funds. If you’re unsure please consult a suitably qualified financial adviser.
DISCLAIMER: AJ Bell is the owner and publisher of Shares. Martin Gamble and Tom Sieber (who wrote and edited this article, respectively) own shares in AJ Bell.

Important information:
These articles are provided by Shares magazine which is published by AJ Bell Media, a part of AJ Bell. Shares is not written by AJ Bell.
Shares is provided for your general information and use and is not a personal recommendation to invest. It is not intended to be relied upon by you in making or not making any investment decisions. The investments referred to in these articles will not be suitable for all investors. If in doubt please seek appropriate independent financial advice.
Investors acting on the information in these articles do so at their own risk and AJ Bell Media and its staff do not accept liability for losses suffered by investors as a result of their investment decisions.