Archived article
Please note that tax, investment, pension and ISA rules can change and the information and any views contained in this article may now be inaccurate.
 magazine
How long does it take to bounce back from a bear market?
This column recently looked at the history of bear markets in the field of UK equities. That analysis has proved to be rather timelier than anticipated, since the FTSE All-Share has just entered the eleventh such downturn in its 58-year history and the FTSE 100 its fifth bear phase since launch in 1984.
To recap, the average bear market in the FTSE All-Share has lasted 385 days and served up a 37% drop in the index, although that covers a wide range. The shortest bear market was just 42 days (1981) and the longest 1,167 (2000-03), while the smallest loss was 21.5% (also 1981) and the worst drop was 72.6% (1972-75).
With the All-Share already down by 31% in just 55 days, investors could be forgiven for at least pondering whether the worst may be over. That may depend upon the length and geographic breadth of the coronavirus outbreak, the scale and sort of fiscal and monetary policy response, and the duration and depth of any recession that ensues owing to the disruption to both global supply chains and global demand.
It should nevertheless be instructive to look at how long it has typically taken the All-Share to recover the ground lost during a bear market, to see if this gives investors any guide as to when they might like to start averaging their way back in, or at least starting to do their research on possible recovery picks.
Recovery phase
The good news is that on all 10 prior occasions, the FTSE All-Share has completely recaptured the ground lost during the previous bear market.
You might think this does not sound like a big deal, but ask any investor with experience of, and exposure to, the Japanese stock market and you might think otherwise. The Nikkei 225 peaked at 38,916 on 31 December 1989 and 31 years later it stands at 17,431.
The bad news is that on eight of 10 occasions, it took the index longer to make up the ground than it did to lose it. This is partly down to the nature of bear markets, which by the nature have tended to be relatively nasty, brutish and short (rather like recessions, compared to economic upturns). It is also just mathematics. If an index halves, it has to double to get back to where it started.
The average time it has taken the All-Share to recover a bear market loss is 648 days, compared to the 385-day average market downturn.
Again, there is a wide range. It took the benchmark just 89 days to bounce back from its 63-day, 21% pummelling in 1975. But it needed 1,529 days to pick itself up after the crunching 2007-09 downturn which featured the global financial crisis and a 49% peak-to-trough decline.
Rally around
It does appear that the longer the preceding bull market and the bigger the gain, the longer the recovery period that is needed. The hangover that followed the 1998-99 and 2003-07 parties suggests as such, although the bear market of 1987 was very, very short and that was sandwiched in between the huge advances of 1981-87 and 1987-98.
All may not be lost this time around, despite the length and extent of the preceding gain, although there is one other phenomenon of which investors need to be aware, namely the bear market rally.
Bear markets are actually littered with sharp advances which cruelly turn out to be nothing more than bear traps for the unwary, who were tempted into a ‘buy-on-the-dip’ strategy, only to quickly find themselves in trouble. The 2003-07 and 2007-09 market drops were classic examples.

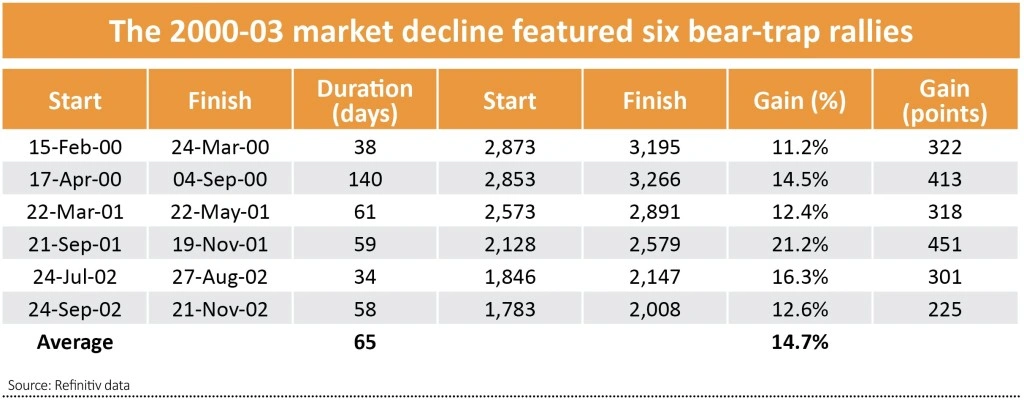
The 2000-03 bear market, which followed the collapse of the technology, telecoms and media bubble, witnessed six major rallies in the All-Share. Those advances generated a combined gain of 2,030 points between them, even as the index moved by 1,649 points from top to bottom, showing how much additional pain would have been suffered by anyone who was tempted to pile into the market by these rallies.
The 2007-09 bear run was no less vicious. Seven rallies just led bulls and dip-buyers to the slaughter as even their 2,420-point cumulative gains could not stop a three-year 1,690-point, peak-to-trough decline.
This is particularly relevant today, after last Friday’s (13 March) 9.8% gain in America’s S&P 500. Bulls will try to fight back. But before that spectacular surge, nine of the S&P’s best single-day percentage gains since 1964 have come during bear markets.
The exception was 10 March 2009 which was the very first day of the 11-year bull run that has just ended. Fingers crossed we get a repeat this time, though history might just be against it.


Important information:
These articles are provided by Shares magazine which is published by AJ Bell Media, a part of AJ Bell. Shares is not written by AJ Bell.
Shares is provided for your general information and use and is not a personal recommendation to invest. It is not intended to be relied upon by you in making or not making any investment decisions. The investments referred to in these articles will not be suitable for all investors. If in doubt please seek appropriate independent financial advice.
Investors acting on the information in these articles do so at their own risk and AJ Bell Media and its staff do not accept liability for losses suffered by investors as a result of their investment decisions.


