Archived article
Please note that tax, investment, pension and ISA rules can change and the information and any views contained in this article may now be inaccurate.
 magazine
The fear index reading could be good news

When Franklin D. Roosevelt was inaugurated in 1933, America was battling the effects of the Great Depression and the country’s 32nd president attempted to rally Americans round by declaring that ‘the only thing to fear is fear itself’.
In the narrow context of financial markets this column does wonder whether there can be more than a grain of truth in that, especially as broader sentiment has switched from greed to fear in less than two months.
Indeed, it has taken the FTSE All-Share just 52 calendar days to fall by more than 20% from its January high and tumble into bear market territory.
Ultimately, no-one has a crystal ball and investors are left weighing up probabilities. This can be done via valuation and also, in a crude, short-hand form, via the VIX index.
WHAT IS THE VIX?
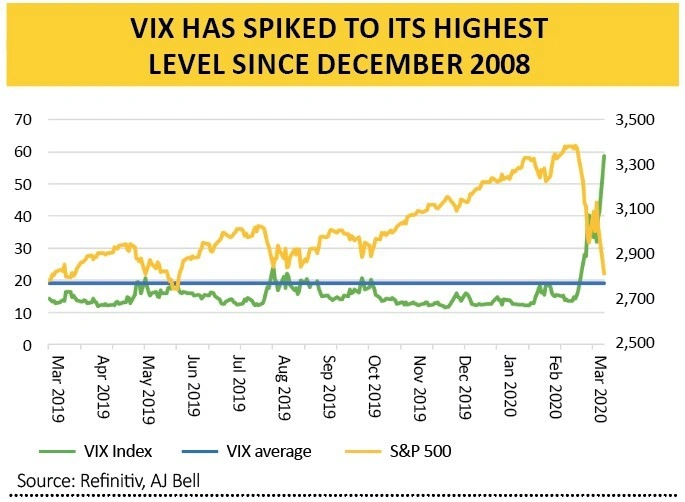
The so-called ‘fear index’, which can be tracked for free via the internet, measures expected future volatility in the stock market (there is a UK equivalent but the US version has a longer trading history so this column will focus on America this week).
The VIX was launched in 1990 and it has averaged a reading of 19 over its history, with a low of 9.1 in November 2017 and a high of 80.86 in November 2008.
The 30 highest VIX readings ever all date from 2008 when the great financial crisis reached its zenith.
The eagle-eyed will immediately note that the VIX hit a low as a bull market was in full flow and reached a peak as bears were in charge and share prices were collapsing in the wake of Lehman Brothers’ collapse.
It is tempting to think that the VIX may be more useful as a contrarian indicator than as a lead indicator – after all, to repeat one this column’s favourite mantras from Warren Buffett, investors should look to be ‘fearful when others are greedy and greedy when others are fearful’.
Panic button
At the time of writing the VIX has just jumped to a reading of 58.75, within the highest 1% of all VIX readings since 1990, so everyone sounds pretty frightened. This begs the question of whether now is the time to panic along with everyone else and run for cover or be contrarian and start to research possible purchases.
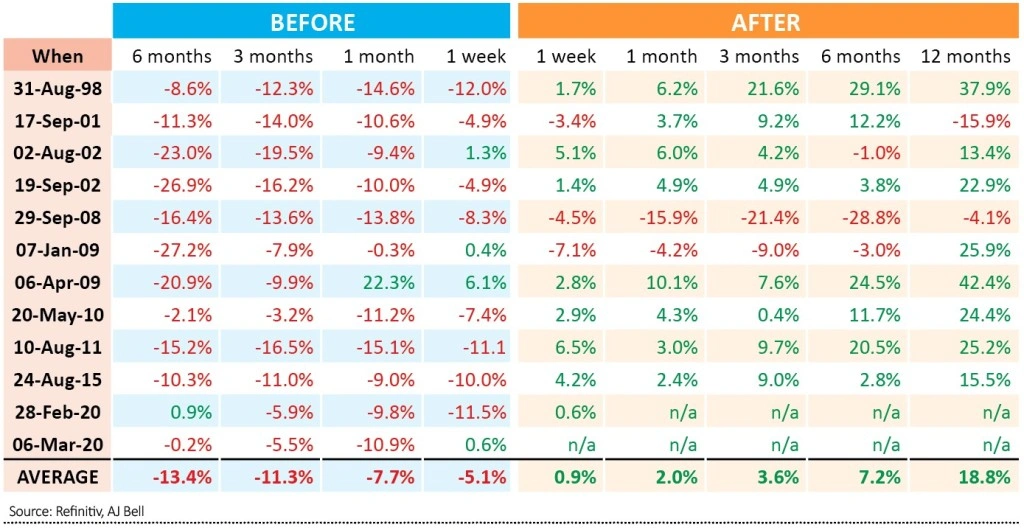
The fear index has moved above 40, more than twice its historic average, just 12 times, including this week. It should therefore be instructive to look at how the S&P 500 has performed ahead of such spikes in the VIX and then how it has fared after them.
Analysis of how the VIX performed in the run-up to a move above that 40 level shows that markets had already begun to fall hard by the time fear really took over.
The S&P 500 lost more than a fifth of its value in the six months preceding a reading of 40 four times out of 12. In fact what is odd about the two occasions this year is how calm markets were beforehand, perhaps because the viral outbreak was just impossible to forecast.
Note also how markets tend to rally after the VIX hits 40, to again support the thesis that it is a contrarian indicator. After a move above 40, the VIX tends to peak on average barely 20 days later, to suggest that by the time the VIX hits this mark the worst may already be behind us.
Cape Fear
As with any trends there are exceptions to the rule. The S&P was lower still 12 months after the 40 mark was crossed in 2001 as the tech bubble burst and 12 months after it got there in September 2008. In both cases, there were two factors at play:
– a lengthy recession
– valuations that peaked at historically lofty levels
The first of those two pre-conditions for an extended period of volatility and further market drops remains open to question now, although it is clearly what investors currently fear.
The second, unfortunately, was very much in place, using the cyclically adjusted price earnings (CAPE) ratio devised by Robert Shiller. Before the latest sell-off, the CAPE multiple of 31.5 times had only been exceeded twice in the S&P 500’s history, 1929 and 2000, and neither of those periods ended well at all.
It is tempting to think that the VIX is telling us that investors have panicked thanks to the unknown threat to economic activity posed by the coronavirus outbreak and noise created by the collapse in oil prices and that markets are oversold as a result.
However, the valuation starting point was so extreme in the US that a slide into recession could still leave the S&P 500 exposed so investors will need to keep a close eye on macroeconomic data and company news flow in the coming weeks and months.
Important information:
These articles are provided by Shares magazine which is published by AJ Bell Media, a part of AJ Bell. Shares is not written by AJ Bell.
Shares is provided for your general information and use and is not a personal recommendation to invest. It is not intended to be relied upon by you in making or not making any investment decisions. The investments referred to in these articles will not be suitable for all investors. If in doubt please seek appropriate independent financial advice.
Investors acting on the information in these articles do so at their own risk and AJ Bell Media and its staff do not accept liability for losses suffered by investors as a result of their investment decisions.