Archived article
Please note that tax, investment, pension and ISA rules can change and the information and any views contained in this article may now be inaccurate.
 magazine
Bouncing back

Would you like to know which areas of the UK stock market held up best during past sell-offs and which performed the best once the market bottomed. Shares has got you covered.
Rather than going back to the tech bubble of the early noughties and the global financial crisis, which are already well-trodden ground, we have focused our research on the last ten years of price movement and in particular three short but sharp market declines.
DIFFERENT CAUSES, SAME REACTION
The three episodes in question – which occurred in mid-2011, mid-2015 to early 2016, and the final quarter of last year – all came about for different reasons. None of them had their origins in the UK, yet all three caused the FTSE 350 to decline by more than 10%.
In 2011, worries over a European sovereign debt crisis – which had already engulfed Greece, Ireland and Portugal on the periphery of the euro-zone – suddenly spread to major continental economies. French, Spanish and Italian bonds were sold off aggressively on worries that their sovereign credit ratings could be downgraded.
The panic spread to equity markets and the UK was dragged down with the FTSE 350 index losing 17% in a matter of weeks between early July and mid-August of that year.
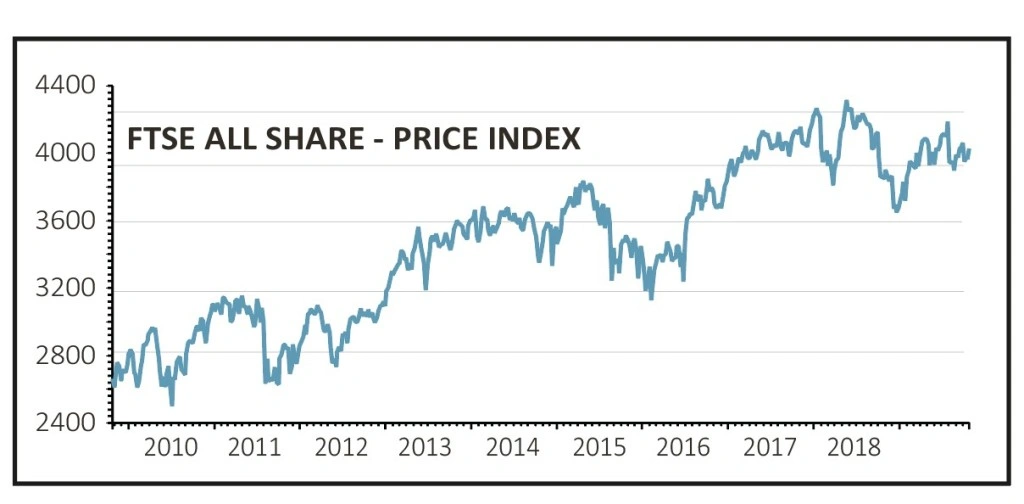
The seeds of the 2015 to 2016 sell-off were sown in late 2014 when the US Federal Reserve withdrew its programme of quantitative easing (QE). Compounding this, China’s gross domestic product (GDP) grew at a slower rate than expected leading it to devalue its currency, and after years of struggling with its economy the Greek government defaulted on its debt.
All told, between May 2015 and mid-February 2016 the FTSE 350 lost just over 20%, although it wasn’t a straight line by any means. Just when investors thought the selling had exhausted itself and the market was set to rally, it took another leg down.
The sell-off in the fourth quarter of 2018 was sparked by an inversion in the US yield curve, as long-term Treasury bond yields fell below short-term yields. An inverted yield curve tends to point to a slump in the economy.
Adding to fears of a recession, president Donald Trump ramped up his trade war with China threatening another round of tariffs on Chinese goods. Finally, volatility rose even more than it normally does in October – a month which has a history of delivering big stock market losses.
Between the end of September and the end of December, the FTSE 350 lost 13.3%, recording one of its worst quarters since the financial crisis.
SHORT SHARP RECOVERY
In all three cases, stocks had recovered their losses six months on from the market lows. In the bounce-back from the 2011 slump, the FTSE 350 gained 17.5%, while in 2016 it rallied 23.3% from the low and in the first six months of this year it gained 15.8%. On average, over six months the index bounced by 18.9% against previous losses of 16.9%.
At no point was there a single, obvious catalyst for any of the sell-offs, nor was there an obvious reason for stocks to stop falling and to start rising. All of which goes to prove the wisdom of the
old adage that ‘time in the market beats timing the market’.
More important than having exposure to the market, however, was having the right exposure. Some sectors fared better than others during the sell-offs and some fared better during the rallies.
Some repeated the same behaviour each time despite the causes of the sell-offs being different. Most interestingly, some fell less than the market on the way down and gained more than the market on the way up.
GETTING DOWN TO BUSINESS
In compiling our research we screened Sharepad for data on FTSE 350 sector returns for each of the three market declines and for the returns six months after the market had bottomed.
We then ranked the sectors by their average return over each of the three down periods and each of the three up periods to see if there were any obvious similarities or patterns in their behaviour. We also compared each sector’s returns against the market.
As some sectors are by nature more volatile than others, even under normal market conditions, we measured the standard deviation of returns.
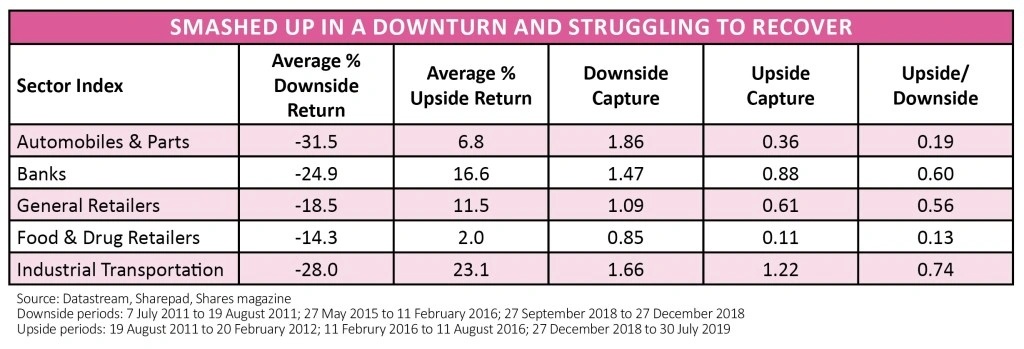
We also measured the extent to which each sector beat or lagged the market on the way down and the way up, to give us an idea of their ‘upside capture’ and ‘downside capture’. Some sectors held up well during market sell-offs but lagged on the way back up, while some lagged on the way down but made up for it on the way up.
Finally, we divided the upside capture by the downside capture to see which sectors beat the market in both the down phase and the up phase, in theory allowing you to stay invested throughout without having to chop and change your portfolio, and which lagged the market during both phases and are therefore best avoided.

TREBLES ALL ROUND
The sector which held up the best on average during all three market sell-offs, and actually gained during the last two major declines, was Beverages. Its average loss of just 3.5% was almost 80% less than the average 16.9% loss for the market over all three periods.
Surprisingly, for what is usually considered a ‘defensive’ sector, it was also one of the most consistent winners during subsequent rallies, rising by an average of 23.6% with very low variation over each of the following six month periods. That’s an average out-performance of 25% versus the typical market recovery of 18.9%.
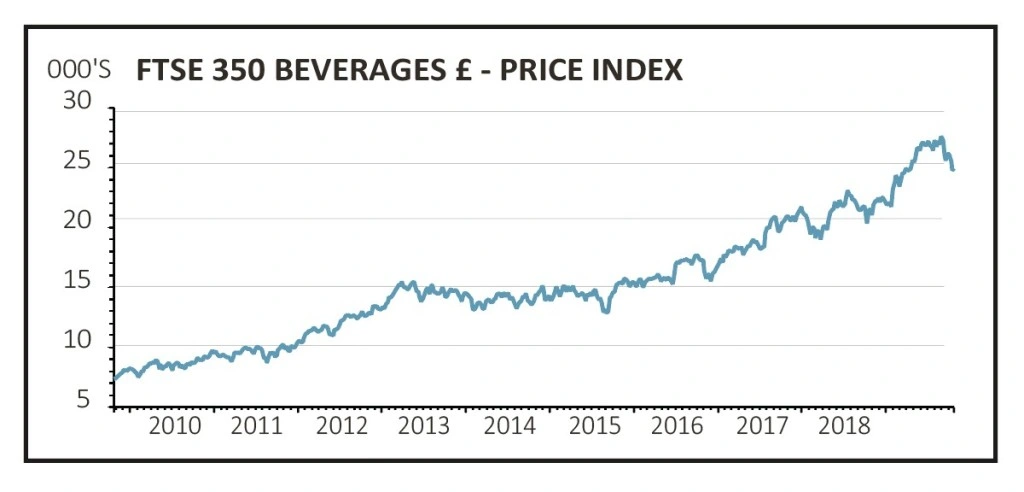
Most impressive of all, the Beverage sector’s ratio of upside capture to downside capture was almost six to one, beating the rest of the market into a cocked hat. Beverages are therefore a must-own if the market is heading into a downturn.
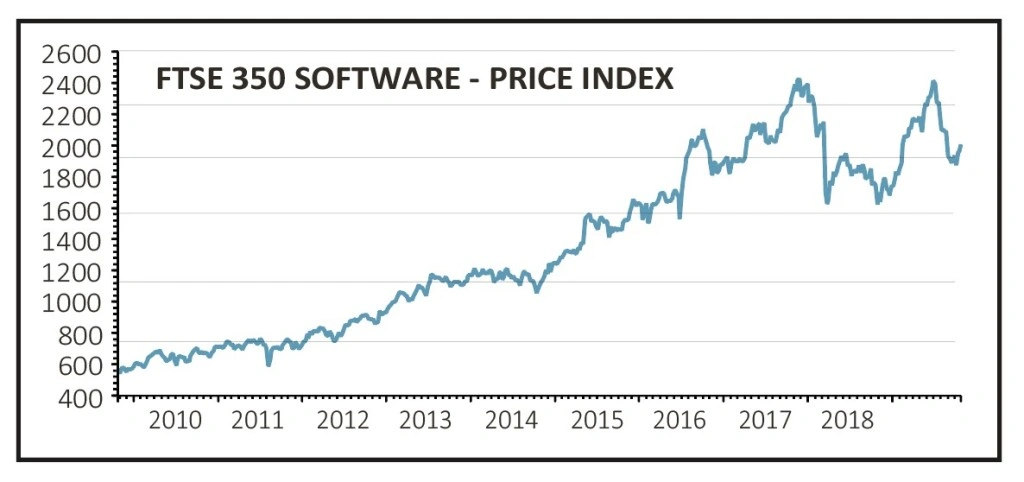
The next best-performing sector was Software, which on average lost 9% or just over half as much as the index during the sell-offs and beat it by more than 50% during the rallies with an average return of almost 30%. Like Beverages, the variation in returns was extremely low both on the way down and on the way up.
For Software to beat the market under any conditions, with a ratio of upside capture to downside capture of nearly three to one, and to do it with low volatility, is an impressive feat.
Third place is more or less a tie between Health Care, Media, Personal Goods and Pharmaceuticals. All lost significantly less than the market on the way down, with Personal Goods the best and Media the worst of the bunch, and all beat the market by between 5% and 10% on average on the way up again.
Owning a basket of stocks in these sectors could not only have produced smaller losses than the market on the downside, but generated considerably bigger gains on the upside without needing to try and time the bottom.
STEER WELL CLEAR
The worst-performing sector during the three sell-offs was Industrial Metals, with average losses of 37.3% or more than double those of the index. Moreover losses varied from -14% to -63% meaning that at one point investors lost almost two thirds of their money.
The fact that they also rallied the most in the recovery phase, with an average return of 68.8% or more than three times that of the index, doesn’t make them any more appealing in our view.

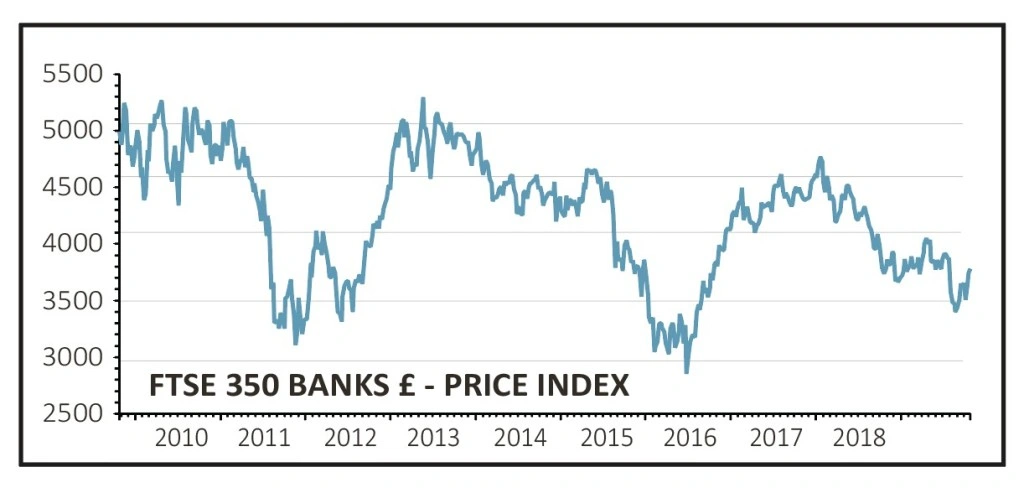
The three sectors which consistently destroyed value both on the way down and the way up were Automobiles & Parts, General Retailers and Banks.
Granted the Auto sector is a shadow of its former self, thanks to the takeover and de-listing of GKN, so the data may not be that useful as a guide when markets sell off in the future. However the other two sectors are still large enough to have a negative impact on the index and generally speaking investors should give them a wide berth.
General Retailers lost an average of 18.5% during the sell-offs but it was their poor showing when the market rallied – lagging the index by 40% on average - which really did the damage.
Banks on the other hand lost considerably more than the market during the sell-offs – an average of nearly 25% with a maximum loss of nearly 40% - and then lagged during the recovery phase meaning not only were they no help when the going got tough but they didn’t make up for it when the rest of the market was going up either.
BAD STOCKS IN GOOD SECTORS
Finally, although it may sound like heresy – and professional investors would never admit to it – but when markets turn ‘bad’ stocks in a good sector typically perform better than ‘good’ stock in bad sector.
When the tech bubble burst at the beginning of the noughties, investors clung onto a diminishing number of ‘good’ tech stocks despite evidence that the sector was imploding. The right strategy would have been to own no tech stocks at all and to load up with cheap mining, utility and staples stocks, even if that meant buying what on the face of it were ‘bad’ stocks.
Similarly, in the last three market sell-offs investors would have done better if they had owned ‘bad’ Beverage and Software stocks than if they had picked ‘good’ Banks or General Retailers.
Important information:
These articles are provided by Shares magazine which is published by AJ Bell Media, a part of AJ Bell. Shares is not written by AJ Bell.
Shares is provided for your general information and use and is not a personal recommendation to invest. It is not intended to be relied upon by you in making or not making any investment decisions. The investments referred to in these articles will not be suitable for all investors. If in doubt please seek appropriate independent financial advice.
Investors acting on the information in these articles do so at their own risk and AJ Bell Media and its staff do not accept liability for losses suffered by investors as a result of their investment decisions.