Archived article
Please note that tax, investment, pension and ISA rules can change and the information and any views contained in this article may now be inaccurate.
 magazine
Is the yield curve reliable or not?

The yield curve on government bonds is grabbing a lot of headlines and not all of them are encouraging ones for investors.
In fact, there are four types of yield curve, using the difference in yield between two and 10-year government bonds as our benchmark.
Normally, the yield on the 10-year paper would be higher than that of the two-year as investors demand compensation for the additional eight years to maturity, as this means there is more time for things to go wrong (inflation, interest rate increases or default being the main three dangers).
• Normal. Here the yield on the 10-year paper is higher than that of the two-year.
• Steep. In this case, long-term yields rise more quickly than near-term ones as investors price in an acceleration in economic growth and interest rate increases. Investors fear being locked into low rates and demand greater compensation for owning longer-dated paper.
• Flat. This is where the bond market is unsure how to proceed. Yields on two and 10-year paper are the same as the economy transitions from downturn to upturn or upturn to downturn.
• Inverted. Here, bond markets fear an economic slowdown or recession and the yield on longer-dated bonds drops below that of shorter-term paper. This happens because investors price in future interest rate cuts in response to the slowdown and a drop in coupons on bonds issued by governments in the future.
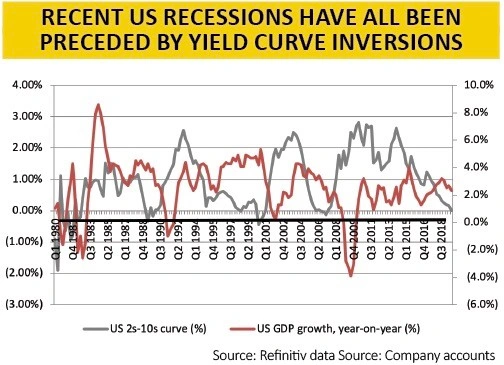
Right now, all the talk concerns the US yield curve and how it is inverting. The yield on US 10-year Treasuries is, at the time of writing, 1.577% compared to 1.569% on two-year Treasuries (and in early August the 10-year yield was nearly 0.10% below that of the shorter-term issue).
This is prompting much hand-wringing because the recessions that began in 1980, 1982, 1990, 2000 and 2007 were all preceded by an inversion of the yield curve.
The prospect of a recession is a worry for those investors exposed to so-called ‘risk assets’ like equities and commodities as it will hit their earnings power and demand for them respectively, to the possible detriment of their valuations and prices.
Enter the banker
All may not be lost for two reasons. First, not every inversion has preceded a recession. In plain English, there have been false signals. Inverted curves in 1994-95 and 1998 did not see a downturn, for example.
Second, Japan’s experiences since 1990 suggest the yield curve can be a poor predictor of economic activity. In the 1980s it wasn’t bad (calling the downturn of 1985 and the 1990 peak rather accurately) but it has been pretty hopeless since then.
This is not to say the Japanese experience is entirely encouraging. After all, it suggests that the yield curve stopped being useful as soon as the Bank of Japan got stuck into zero interest rate policies and quantitative easing (QE) in the early 1990s, as it responded to the bursting of the country’s debt-fuelled stock market and property bubble. In other words, central bank manipulation of the bond market has dulled the indicator’s edge.
Stock market signs
Even if the bankers can muddy the bond market waters can they actually stave off a downturn and a fall in equity markets (forever)?
In Japan, the yield curve has become of progressively less use when it comes to trying to read where the Nikkei 225 stock index may go. If anything, a steeper yield has signalled lower stocks (as the Bank of Japan tried to raise rates and step back from QE) and a flattening one has foretold of higher share prices (as the BoJ stepped on the monetary gas once more).
We therefore have to see whether Mark Carney (and his successor) at the Bank of England and Jay Powell at the US Federal Reserve are as successful in bending markets to their monetary will.
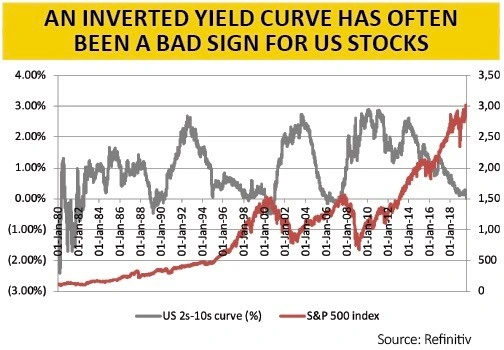
Inverted yield curves in 2000 and 2007 helped to call the top for the FTSE All-Share index – and the UK yield curve is inverting again right now.

An inverted curve also warned of trouble in the US in the early 1990s, 2000 and 2007. And even when the yield curve was wrong on the economy in 1994-95 and 1998, financial markets were very volatile, thanks to the Mexican peso devaluation crisis of 1994 and the Asian and Russian debt bombs and devaluations of 1997-98.
So even if the bankers can fend off a recession, who is to say that investors should put blind faith in them when it comes to share prices?

Important information:
These articles are provided by Shares magazine which is published by AJ Bell Media, a part of AJ Bell. Shares is not written by AJ Bell.
Shares is provided for your general information and use and is not a personal recommendation to invest. It is not intended to be relied upon by you in making or not making any investment decisions. The investments referred to in these articles will not be suitable for all investors. If in doubt please seek appropriate independent financial advice.
Investors acting on the information in these articles do so at their own risk and AJ Bell Media and its staff do not accept liability for losses suffered by investors as a result of their investment decisions.


