Archived article
Please note that tax, investment, pension and ISA rules can change and the information and any views contained in this article may now be inaccurate.
 magazine
The different ways to play the US markets via ETFs

The US stock market is the largest in the world and encompasses shares in household names such as McDonald’s, Disney and Facebook.
It has also been an extremely strong performer in recent years. On 10 July the S&P 500 index hit a new record high above the 3,000 level, just five years after attaining the 2,000 mark.
It is also the geographic market with the largest selection of London-listed exchange-traded funds from which you can achieve low-cost exposure.
There are several different indices tracked by US ETFs and it is worth a prospective investor being fully aware of the differences between them and what they are actually buying when they settle on a product.
TRACKING US LARGE CAPS
Although investors are probably most familiar with the likes of the S&P 500 and the Dow Jones Industrial Average indices, several ETFs actually track the MSCI USA index including Xtrackers MSCI USA (XMUS) which has an ongoing charge of 0.07%.
This index encompasses some 643 companies accounting for more than 80% of the total market value of US shares. The likes of Microsoft, Apple, Johnson & Johnson and others are all present and correct.
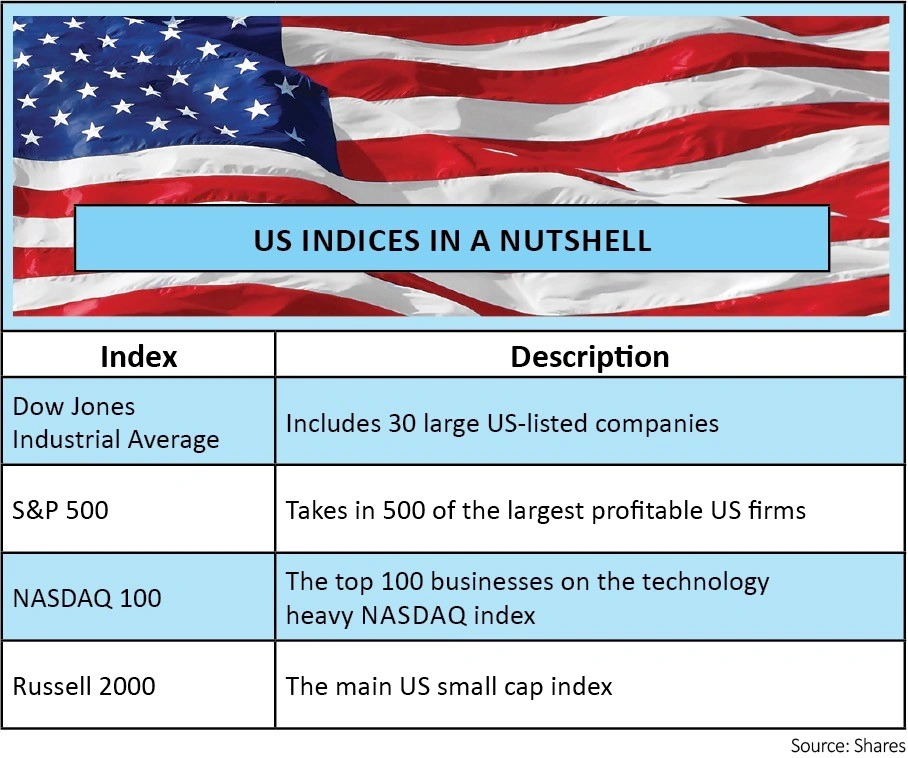
In that sense it is fairly similar to the S&P 500 which, as its name suggests, includes 500 of the largest US firms.
However, there is an interesting feature of the S&P 500 which distinguishes it from other indices. Companies can only be included in the index if they have delivered a profit over the previous year.

Like MSCI USA, the S&P 500 covers about 80% of the US stock market, however, it excludes companies such as Tesla and Uber as they do not make consistent profits.
Therefore investors buying a product tracking the S&P 500 are effectively getting a modest bias towards quality stocks given the profitability rule.

NEW CHEAPER PRODUCTS
In addition to offering exposure to the S&P 500, several providers are bringing new ETFs to the market tracking alternative indices from the likes of Morningstar and Solactive.
These are good lookalikes for the S&P 500 and because the index providers charge less, it enables the ETF issuer to charge investors less.
Examples include L&G US Equity (LGUG) and Lyxor Core Morningstar US (LCUS) which have ongoing charges of 0.04% and 0.05% respectively.
It is also worth considering the costs associated with trading the products, not just those levied by your platform provider but also the bid/offer spread which is the difference between the price at which you can buy and sell the shares.
As some of these new instruments are less widely held the spread can be higher and for this reason investors may want to stick with the larger and more widely traded ETFs which track the S&P 500. Examples include iShares Core S&P 500 (CSP1) and Vanguard S&P 500 (VUSA) which both have ongoing charges of 0.07%.
WHAT ABOUT THE DOW?
There are several ETFs which follow the Dow Jones Industrial Average, including iShares Dow Jones Industrial Average (CIND). The Dow is a price-weighted average of 30 actively traded blue-chip stocks.
Price-weighted means their weighting on the index, and therefore the influence over how the wider index trades, is determined by share price rather than market valuation.
The means by which companies get into the Dow Jones Industrial Average is a bit vague. The companies tend to be leading operators in their respective industries and are very large.
It is quite rare for the Dow to keep changing names as it takes an important change in a company for it to be removed by the committee which runs the index.
In July 2018 the final original constituent of the index, General Electric, was ejected and replaced by the Walgreens Boots Alliance drugstore chain following a period of turmoil for the industrial conglomerate.
OTHER WAYS TO PLAY THE US
Another US index followed by ETFs is the NASDAQ 100 which is dominated by big technology stocks like Microsoft, Apple and Amazon. For example, ETF Invesco NASDAQ 100 (EQQQ) follows this index and has an ongoing charge of 0.3%.
The Russell 2000, tracked by several ETFs including SPDR Russell 2000 US Small Cap (R2SC), includes a group of smaller US stocks whose fortunes are typically more closely tied to the domestic economy.
For the most part these are still relatively large companies. The median market cap of stocks on the Russell 2000 is $791m and the largest stock, Array Biopharma, is currently being taken over for $10.6bn.
While only a few constituents would be well known on this side of the Atlantic, Build-A-Bear Workshop may perhaps resonate with parents of small children given its UK high street presence.
SPECIALISED EXPOSURE
For investors who want more specific exposure, there are numerous ETFs which track different sectors as well as products which filter the US market to identify stocks with specific attributes. These range from sustainability factors to financial metrics.
For example, Invesco High Dividend Low Volatility S&P 500 (HDLV) uses screens to identify higher dividend-paying members of the S&P 500 and may therefore be of interest to investors seeking a source of income.
Important information:
These articles are provided by Shares magazine which is published by AJ Bell Media, a part of AJ Bell. Shares is not written by AJ Bell.
Shares is provided for your general information and use and is not a personal recommendation to invest. It is not intended to be relied upon by you in making or not making any investment decisions. The investments referred to in these articles will not be suitable for all investors. If in doubt please seek appropriate independent financial advice.
Investors acting on the information in these articles do so at their own risk and AJ Bell Media and its staff do not accept liability for losses suffered by investors as a result of their investment decisions.