Archived article
Please note that tax, investment, pension and ISA rules can change and the information and any views contained in this article may now be inaccurate.
 magazine
Three quick ways to test the strength of the US market

After a lot of huffing and puffing to recapture the ground lost since January, America’s S&P 500 index is trading at fresh all-time highs and in the process setting new records for the longest bull run in US stocks in history at 3,461 days and counting.
The 428% rise since the post-Lehman bottom on 9 March 2009 is not, however, the best advance forged during a bull run. Between October 1990 and March 2000, the S&P 500 romped higher by 518%.
To match that gain, the S&P 500 must therefore get to 3,505, some 20% higher than where we are now.
One factor in the S&P 500’s rise this year has been very strong earnings growth as the US economy has picked up steam, helped by the tax cuts pushed through by the Trump administration in late 2017.
And with interest rates slowly rising, and the Federal Reserve also withdrawing quantitative easing, profit growth will have to remain strong if stocks are to resist the gravitational pull of higher returns on cash, which just might one day tempt investors to take on less risk and lessen their portfolio allocation to equities.
Onward and upward
After 20% year-on-year growth in the first quarter of 2018, analysts went into July looking for a 38% surge in the second quarter of the year, buoyed by tax cuts, share buybacks, initial dollar weakness and also a strong operational performance from oil and technology firms in particular.
The good news is that corporate America has delivered in style. With just a handful of S&P 500 members yet to report, earnings look set to rise 43% year-on-year, with operating margins and earnings per share reaching fresh all-time highs, at 11.6% and $38.72 for the quarter respectively.
Better still, profit growth looks to be accelerating.
This helps to explain why US stocks trade at fresh all-time highs of their own, at least using the S&P 500, NASDAQ Composite and the small-cap Russell 2000 indices as benchmarks, with only the share-price weighted Dow Jones Industrials letting down the side.
But this also implies that profit growth forecasts must be met or exceeded and operating margins maintained or increased to help US stocks sustain their momentum.
It will therefore be interesting to see if any US firms flag any negative impact from tariffs, costs or the dollar. No-one is expecting a 2008-09 style margin collapse but with US stocks having done so well any disappointments could be taken badly, since arguments that the US market is still cheap largely rest on the assumption that profit margins will stay at their new highs forever (or go up even more).
Three against the field
Checking out some 500 sets of results every three months is a laborious job that will be beyond most investors. To cut out of some of the donkey work, investors might like to keep an eye on three sector indices to help them take markets’ temperature as the earnings numbers flood in once more.
All three tap into the US economy and tend to be good indicators of wider stock market sentiment. While the past is by no means guaranteed to repeat itself, the S&P 500 tends to do well when these three sectors are doing well and not so well when they are doing badly.
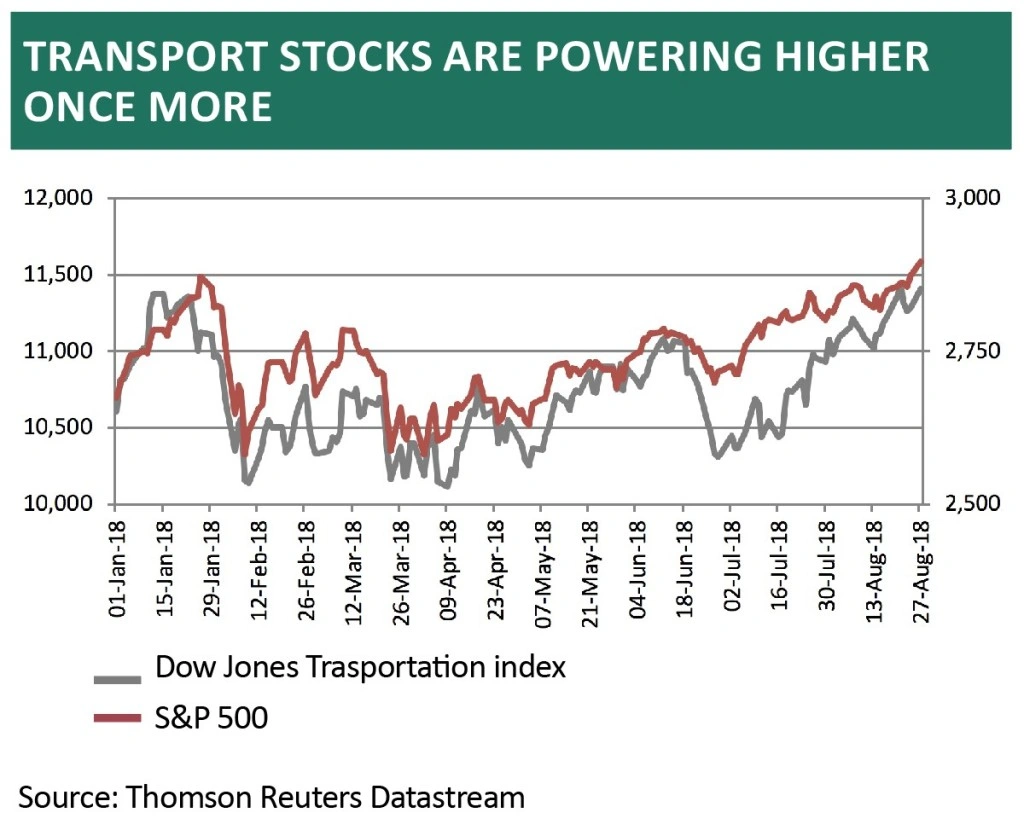
1. Transport. The old theory is that if the economy is doing well, the transport stocks will do well, as goods are being sold and therefore new supplies must be shipped. Bulls will be delighted to see that the Dow Jones Transportation index is rumbling higher again after a slight skid in the summer.
2. Semiconductors. The Philadelphia Semiconductor index, or SOX, contains 30 companies involved in the design, manufacture and sale of silicon chips and it is therefore a very useful guide for investors on two counts.
These integrated circuits are everywhere, from smart phones to computers to cars to robots, so they offer a great insight into end demand across a huge range of industries and therefore the global economy.
Chip-makers’ and chip-equipment makers’ shares are generally seen as momentum plays, where earnings growth is highly prized and valuation less of a consideration. As such they can be a good guide to broader market appetite for risk.
The SOX is up by 11.5% this year and the S&P 500 by 8.5% so that looks good, although investors need to watch the chipmakers’ inability to set new highs. This may reflect lingering concerns over trade disputes with China in particular.

3. Banks. Both the economy and the financial markets need healthy banks if they are to thrive so a feeble performance from Philadelphia Banks index is a concern.
Real weakness, rather than mere underperformance, could warn of economic and market troubles ahead since the sector lost momentum in early 2007, well before the peak in the S&P 500 and before the great financial crisis broke.

Conclusion
History suggests bull markets end when interest rates are rising, valuations are stretched and earnings disappoint. The first is undeniable, the second arguable but the third, for now, is not a concern, especially with transport and chip stocks blowing hot, although any further cooling in the banks’ momentum could yet be an early warning signal.
Important information:
These articles are provided by Shares magazine which is published by AJ Bell Media, a part of AJ Bell. Shares is not written by AJ Bell.
Shares is provided for your general information and use and is not a personal recommendation to invest. It is not intended to be relied upon by you in making or not making any investment decisions. The investments referred to in these articles will not be suitable for all investors. If in doubt please seek appropriate independent financial advice.
Investors acting on the information in these articles do so at their own risk and AJ Bell Media and its staff do not accept liability for losses suffered by investors as a result of their investment decisions.
Issue contents
Big News
- Solid reasons why Headlam still looks attractive despite recent profit warning
- Is a ‘no deal’ risk rising for Sainsbury’s?
- What do Wonga’s woes mean for UK listed subprime lenders?
- Electra takes down ‘for sale’ sign
- FTSE 250 promotion could be the catalyst Avast needs
- Clarkson directors sell shares worth £3.6m


