Archived article
Please note that tax, investment, pension and ISA rules can change and the information and any views contained in this article may now be inaccurate.
 magazine
How to adjust price-to-earnings ratios for debt and cash
Experienced investors should be familiar with the price-to-earnings (PE) ratio. For the less experienced, it is the most popular way of valuing companies and their share prices, certainly among retail investors.
Even fund managers, equity analysts and other investment professionals commonly use it to help spot investment opportunities.
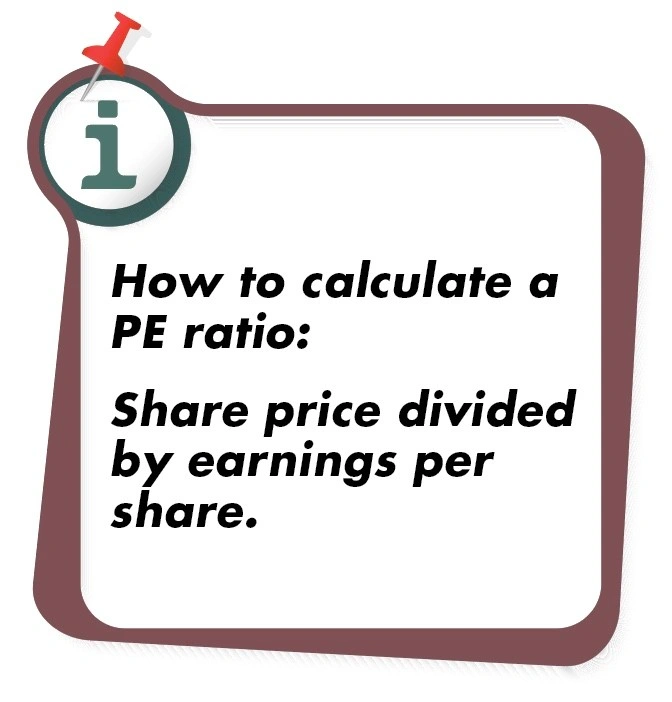
Very easy to calculate and apply; the simplicity of PE makes it such a powerful investment tool. This article will show you how it works in practice and its pros and cons.
Let’s say Company X trades at 180p and its latest set of full year results show 15p of earnings per share (EPS). Its PE would be 180/15 = 12.
Many investors prefer to use forecast data, as the stock market is forward looking and prices in expectations for earnings rather than historical information.
Company X is forecast to make 16p EPS in the current financial year. Therefore with its 180p share price, the stock trades on a forward PE of 11.25.
PE ratios are not flawless and they can be a bit of a blunt instrument. Earnings forecasts aren’t always accurate and they can occasionally fail to take into account hefty risks and industry-specific factors.
You also have to consider that low PE ratios – say anything below 10-times – don’t necessarily point to a stock that is cheap. There could be a good reason as to why the stock is trading on a low rating, such as major financial problems.
For example, in 2015 outsourcing company Carillion looked cheap at 300p on a PE of around 10. Three years later it was bust.
An important lesson from Carillion’s collapse is that simple PEs mask debt, and cash.
HOW DO YOU GET ROUND THIS ISSUE?
There is some very sensible valuation analysis that takes the amount of net debt or cash on the balance sheet into account.
Banks and credit rating agencies will typically assess a company’s net debt-to-earnings before interest, tax, depreciation and amortisation (EBITDA), to do just that.
As a rule of thumb, a net debt/EBITDA above 3-times for any company (barring finance or utility firms) would be considered high and an uncomfortable ratio.
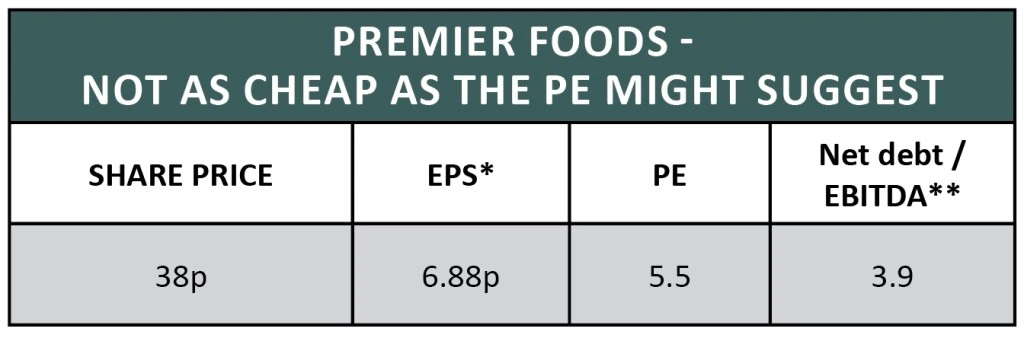
Mr Kipling baker Premier Foods (PFD) is a good example.
As you can see from the table, Premier Foods’ shares look very cheap trading on a PE ratio of 5.5-times. But the picture looks quite different when the company’s £535.3m of net debt (half year figure) is put into the mix.
Its net debt/EBITDA ratio is 3.9 which is above the 3-times level at which many investors start to get nervous.
Its shares are clearly a much more risky investment because of the debt, which largely explains why the PE is so low.
PE: ADJUSTED FOR DEBT AND CASH
EBITDA is not every investor’s cup of tea. Criticisms include the measure making companies look more profitable by excluding the D and A bits (depreciation and amortisation).
That can have the effect of making share prices appear less expensive than they otherwise might, and it can also skew interest cover, something that is important for companies carrying a decent amount of debt.
Complaints about EBITDA go deeper and are more complex than the scope of this article, but investors can make a fairly simple adjustment directly to a PE ratio to reflect debt/cash, making it a more useful comparison tool between stocks.
Let’s look at a real life example.
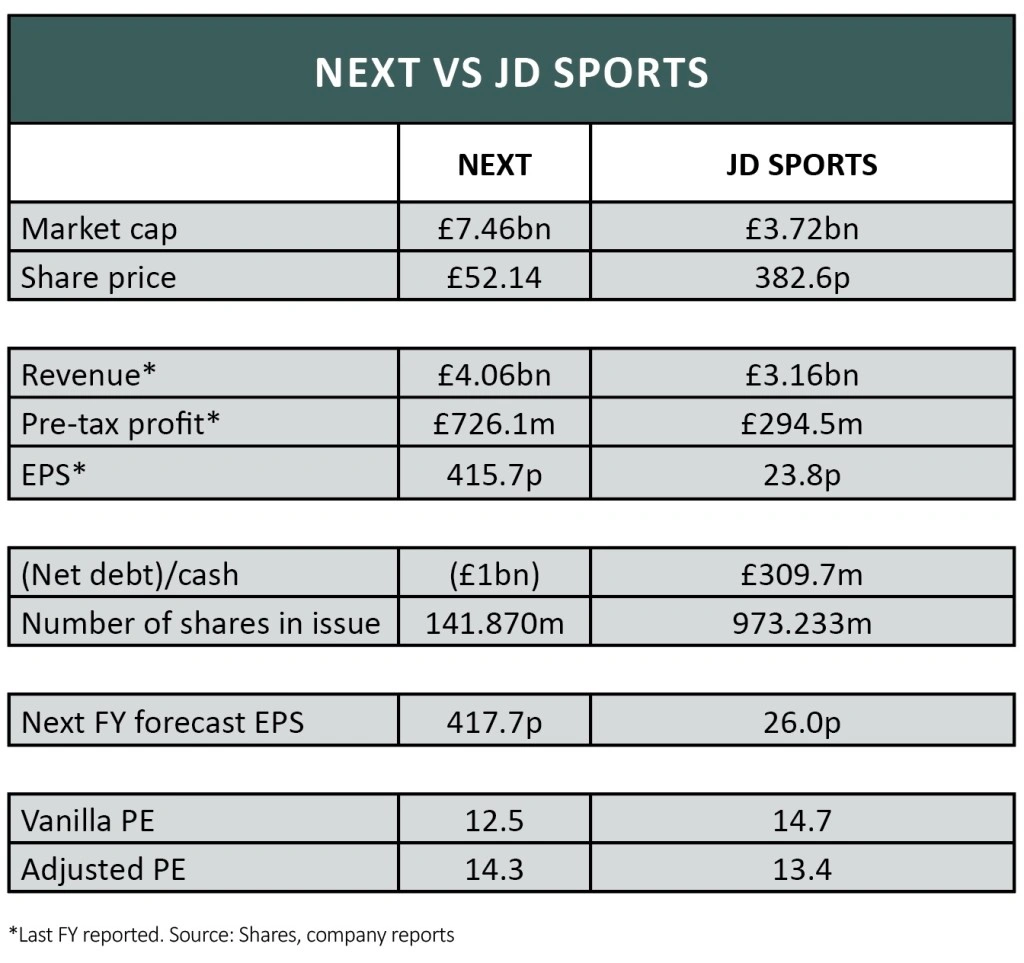
Both Next (NXT) and JD Sports (JD.) have a visible presence in shopping malls and on high streets across the UK.
The pair generates more than £4bn and £3.2bn in annual sales respectively, and they rack up hundreds of millions of pounds a year in profit.
They are members of the FTSE 100 and FTSE 250 respectively and command market valuations of about £7.5bn and £3.7bn respectively.
At face value using the vanilla PE ratio, Next appears to be trading at a near-15% discount to JD Sports (12.5 versus 14.7).
The underlying debt/cash adjusted reality is the opposite; Next is actually trading on a near-7% premium to JD Sports.
RUNNING THE DEBT/CASH PE ADJUSTMENT
To calculate the debt/cash adjusted PE you need four bits of financial data, all readily available in half or full year results, and from many investment websites:
- Market cap
- Net debt or net cash figure
- Number of shares in issue
- Forecast EPS for the current financial year

Let’s use Next as a working example:
As you can see from the accompanying table, Next is more expensive than JD Sports on an adjusted PE basis.

There are many other factors to consider from an investment perspective with these two retailers including currency issues for input and output costs, and the length of shop leases (ie. flexibility to relocate or close sites if necessary without incurring major costs).
However, the PE will certainly give you a good starting position when trying to get an idea for whether the shares are cheap or expensive.
Important information:
These articles are provided by Shares magazine which is published by AJ Bell Media, a part of AJ Bell. Shares is not written by AJ Bell.
Shares is provided for your general information and use and is not a personal recommendation to invest. It is not intended to be relied upon by you in making or not making any investment decisions. The investments referred to in these articles will not be suitable for all investors. If in doubt please seek appropriate independent financial advice.
Investors acting on the information in these articles do so at their own risk and AJ Bell Media and its staff do not accept liability for losses suffered by investors as a result of their investment decisions.
Issue contents
Big News
- Eurozone relief... but for how long?
- Good week for the markets but setbacks for Reckitt and Clarkson
- Stadium purchase to accelerate TT Electronic’s profits scale
- Online isn’t necessarily the ticket to retail success
- Should shareholders get involved with Capita’s £701m rights issue?
- Fast growth vaping firm Supreme to float on the stock market