Archived article
Please note that tax, investment, pension and ISA rules can change and the information and any views contained in this article may now be inaccurate.
 magazine
FTSE 350 stocks going cheap

We’ve run some numbers to see which FTSE 350 stocks come out as the cheapest based on three of the most popular valuation metrics.
It is important to remember that some stocks will be cheap for a reason, so make sure you always research each one thoroughly before making an investment decision.
STOCKS ON A LOW PE RATIO
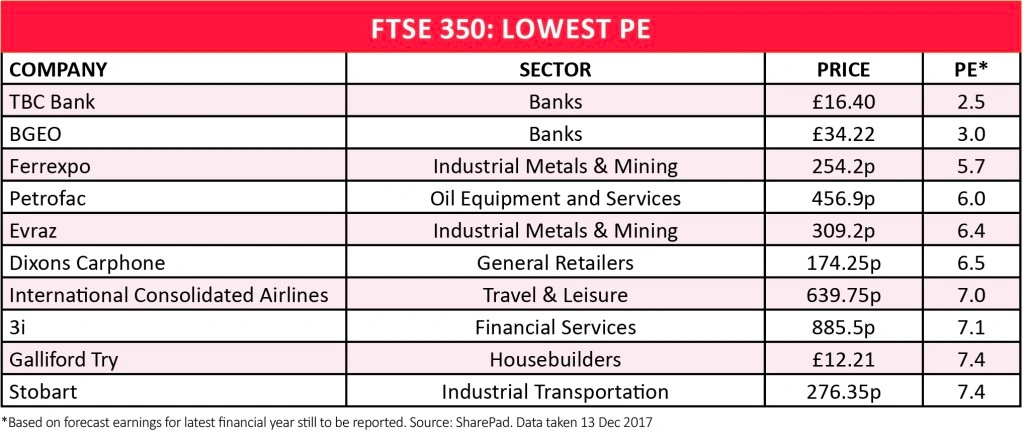
The PE (price to earnings) ratio is a simple way of establishing the value of a share. It is calculated by taking the latest share price and dividing it by the earnings per share of the company.
Fast-growing companies can often command a PE multiple in excess of 20; slow, pedestrian companies tend to be valued around 10 to 14 times earnings in a normal market; and companies with either financial and/or trading problems will inevitably have a PE ratio below 10.
However, you can occasionally find stocks with a PE below 10 because the market has misunderstood its situation, creating an opportunity to buy something which may progress to a higher valuation in time.
The trick for investors is to look at the low PE names and judge which companies have been unfairly marked down and could re-rate once they’ve shown the ability to succeed.
Shares rally and still cheap
International Consolidated Airlines (IAG) looks cheap on a PE basis, despite its share price having already risen by 43% this year. It has enjoyed earnings upgrades which has pushed up its valuation.
Full year profit is expected to jump by nearly a
fifth this year as the British Airways owner benefits from improving ticket prices, cheaper fuel and the collapse of rivals.
The depressed valuation at oil services firm Petrofac (PFC) reflects the damage wrought after it was raided by the fraud squad earlier this year.
Numis has a ‘buy’ recommendation on the stock and a 600p price target. However, the continuing investigation by the Serious Fraud Office, centred on alleged bribery, corruption and money laundering associated with contracts in Kazakhstan makes this a very high risk stock.
Even if any fine doesn’t match the £1bn+ knocked off the company’s valuation, the damage to its reputation could undermine future business.
Construction firm Galliford Try (GFRD) has seen its valuation hit by problems on legacy contracts. However, the company has a plan to boost profit by more than 60% out to 2021 driven by its housebuilding and regeneration divisions.
What do high PE ratios mean?
If low PE ratios help you spot cheap companies, including some that are cheap for a negative reason then high PE ratios can do the reverse. They can help to identify companies which are either grossly overvalued or where the market is happy to pay a premium because growth prospects are very good.
If you are either bearish about the market and believe a big correction is coming or reckon all the big upside on future sales growth has already been factored in to a company’s share price, then going ‘short’ – i.e. betting the share price will fall – on high-PE stocks may be a strategy to consider.
It is also worth remembering that highly-rated stocks can fall fast on the slightest bit of bad news, another reason why it can pay to be negative on equities with high PE ratios.
Current examples of stocks with high PE ratios include food delivery group Ocado (OCDO) which trades on 250 times forecast earnings. Software firm Sophos (SOPH) trades on 120 times forecast earnings.
STOCKS ON A LOW PEG RATIO

The PEG (price to earnings to growth) ratio is a measure of value that combines a company’s price to earnings (PE) ratio and its rate of earnings growth.
A low PEG indicates you’ll pay a low price for future earnings growth, anything below a reading of 1.0 is considered cheap.
Banking group BGEO (BGEO) is cheap on both a PE and PEG basis, perhaps due to a lack of investor understanding of Georgia as a country and its financial/economic situation.
Formerly known as Bank of Georgia, BGEO provides retail and corporate banking plus wealth management.
It will split the group into two during the first half of 2018, being the banking business and the investment business. The latter’s assets include a 57.8% stake in London-listed Georgia Healthcare (GHG) and various interests in real estate, utilities, beverages and insurance.
Last month investment bank Jefferies gave a glowing appraisal of BGEO’s third quarter performance, saying the business was ticking all the boxes of its ‘buy’ thesis. It notes the banking business mix is shifting towards the higher return retail side plus loan growth was strong.
Reasons behind discounted valuation
When examining stocks which look like bargains based on valuation metrics it is important to consider the context. According to Sharepad’s data doorstep lender Provident Financial (PFG) trades on a price to earnings to growth ratio of just 0.2.
This requires a measure of faith in the company’s ability to hit earnings forecasts. It is questionable if this faith is warranted given multiple profit warnings in 2017 and probes by the Financial Conduct Authority into various parts of the business – the latest involves Provident’s Moneybarn sub-prime car finance business.
Non-life insurers Beazley (BEZ) and Hiscox (HSX) see their own figures skewed by the hundreds of millions of pounds worth of losses associated with an unusually active US hurricane season. Hurricanes Harvey and Irma lead to a big hit to 2017 profit.
The earnings growth forecast for 2018 is therefore just a recovery to somewhere approaching previous levels, rather than representing material progress for either business.
STOCKS ON A LOW EV/EBITDA RATIO
EV/EBITDA stands for enterprise value to earnings before interest, tax, depreciation and amortisation. The valuation metric arguably has a key advantage over PE as it factors in a company’s debt position. EV is the market value of its equity plus its total borrowings. It essentially tells you how much a buyer would have to pay to acquire the whole company rather than the equity part of it.
EV/EBITDA is a popular way to measure a company’s pre-interest, pre-tax gross operating cash flow. You have to consider that many companies have different depreciation, amortisation and tax, all of which distort earnings per share numbers. Using EBITDA helps to remove those distortions.
There are some downsides of using EBITDA such as the fact that it ignores differences in accounting policies such as revenue recognition and the capitalisation of costs.
Mining sector going cheap
The accompanying table of stocks on a low EV/EBITDA multiple is dominated by mining companies. Commodity prices can be very
volatile so perhaps investors are sceptical over the accuracy of earnings forecasts.
Looking at recent analyst commentary on Anglo American (AAL) for example, being one of the stocks on our table, it looks cheap on an EV/EBITDA basis, so too with a strong free cash flow yield, yet many analysts aren’t too excited given uncertainty over its main commodities, plus macro and operational risks.
It may still be worth looking at the list of ‘cheap’ miners if there are specific commodities on which you have a positive view, assuming the relevant stocks are producers of said commodities.
Elsewhere on our list is travel agent Thomas Cook (TCG); it faces stiff competition from online travel agents and low-cost airlines, perhaps why it is trading on a low EV/EBITDA multiple.
‘Thomas Cook remains in the middle of a transformational restructuring to combat competitive intensity,’ says investment bank Berenberg. ‘The costs of the restructuring are significant, while the steps being taken are not, so far, resulting in any easing in any of the challenges faced, although profitability has improved.’ (DC/TS)

Important information:
These articles are provided by Shares magazine which is published by AJ Bell Media, a part of AJ Bell. Shares is not written by AJ Bell.
Shares is provided for your general information and use and is not a personal recommendation to invest. It is not intended to be relied upon by you in making or not making any investment decisions. The investments referred to in these articles will not be suitable for all investors. If in doubt please seek appropriate independent financial advice.
Investors acting on the information in these articles do so at their own risk and AJ Bell Media and its staff do not accept liability for losses suffered by investors as a result of their investment decisions.
Issue contents
Big News
- Regulators take aim at trading platforms
- Purplebricks pasted on cost concern
- Heavyweights join OneMedia board
- Another video games developer joins stock market
- Tough festive trading to put retailers to the test
- UK water companies facing earnings, dividends pressure
- What does Disney-Fox deal mean for Sky shareholders?
Editor's View
Feature
Great Ideas Update
Investment Trusts
Main Feature
- Share pick for 2018: Future
- 10 superb stocks for 2018
- Share pick for 2018: DotDigital
- Share pick for 2018: Alliance Pharma
- Share pick for 2018: Johnson Matthey
- Share pick for 2018: Biffa
- Share pick for 2018: Dixons Carphone
- Share pick for 2018: Charter Court Financial Services
- Share pick for 2018: Sage
- Share pick for 2018: Dignity
- Share pick for 2018: AB Dynamics