Archived article
Please note that tax, investment, pension and ISA rules can change and the information and any views contained in this article may now be inaccurate.

Last week this column touched on the issue of the vexed issue of the valuation of the UK stock market, using market capitalisation to GDP as the key metric. The results provided a bit of a question mark over the long-term direction of stocks, given that on this metric the UK looks expensive relative to its own history, unless corporate profitability and efficiency keeps improving from what are pretty much record high levels already.
Other approaches lend themselves to the opposite conclusion and one in particular suggests UK stocks could offer some value, as benchmarked by a FTSE All-Share index near the 3,370 mark, albeit with some caveats.
Three angles provide succour is offered to bulls of the UK equity market and they are all based on the dividend yield.
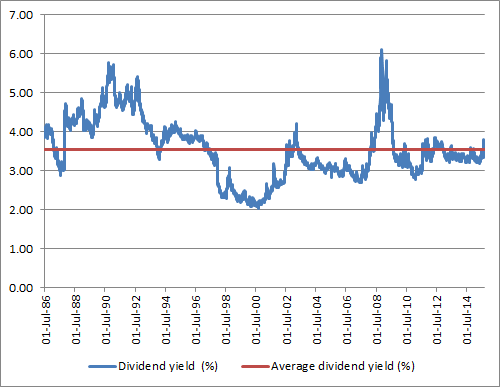
- The first graphic shows the FTSE All-Share and its dividend yield since 1986. The flat line is the long-term average yield, or 3.5% against the 3.62% on offer at the time of writing. That looks marginal but it is a start.
The FTSE All-Share currently offers a slightly higher dividend yield than its near-20 year average
Source: Thomson Reuters Datastream
NOTE: Past performance is not a guide to future performance and some investments need to be held for the long term.
- Things get more interesting when the yield available on equities is assessed on a relative basis to cash or the 10-year Gilt yield. In the latter case, the FTSE All-Share offers more than Gilts by some 170 basis points (or 1.7%). Until six years ago, bonds always yielded more (when the chart here goes below zero).
- This looks more intriguing still when the yield differential between the All-Share and the 10-year Gilt are run next to each other. This suggests, in a post-2008 context at least, an equity yield premium of 200 basis points (or 2.0%) has provided a good entry point for equities.
A 2% yield gap between the FTSE All-Share and 10-year Gilts has twice yielded an entry point to equities since 2008

Source: Thomson Reuters Datastream
NOTE: Past performance is not a guide to future performance and some investments need to be held for the long term.
We all know the past is no guarantee for the future. This technique also runs the risk that dividend forecasts prove too optimistic and that Gilt yields increase as interest rates rise, closing the yield gap – plus share prices could go down as well as up and undo any benefit of the yield by delivering a capital loss.
At least in the case of interest rates, the Bank of England seems in no rush to hike borrowing costs, especially as the US Federal Reserve has deferred such a decision once more. This will place a premium on income for many investors and the UK equity market has the potential to offer some welcome dividends, judging by charts above. Those investors reluctant to take up the challenge of picking individual stocks for their yield can outsource that part of the process to actively-run funds, in exchange for a fee, and there is no shortage of choice.
The top-five performing UK Equity Income OEICs over the last five years
| OEIC | ISIN | Fund size £ million | Annualised five-year performance | Dividend yield | Ongoing charge | Morningstar rating |
| Unicorn UK Income B (Inc) | GB00B00Z1R87 | 609.1 | 19.1% | 4.4% | 0.81% | ***** |
| PFS Chelverton UK Equity Income B (Inc) | GB00B1FD6467 | 339.1 | 18.3% | 5.3% | 1.00% | ***** |
| Threadneedle UK Equity Alpha Income (Inc) | GB00B12WJV48 | 771.1 | 14.0% | 4.7% | 1.62% | ***** |
| Henderson Global Care UK Income (Inc) | GB0005030373 | 115.7 | 13.7% | 4.1% | 0.86% | **** |
| Evenlode Income B (Acc) | GB00B40SMR25 | 201.2 | 13.7% | 4.1% | 1.25% | **** |
Source: Morningstar
NOTE: Past performance is not a guide to future performance and some investments need to be held for the long term.
The top-five performing UK Equity Income Investment Trusts over the last five years
| Investment company | EPIC | Market cap (£ million) | Annualised five-year performance * | Dividend Yield | Ongoing charges ** | Discount to NAV | Gearing | Morningstar rating |
| Investment Company | INV | 18.5 | 31.4% | 5.7% | 2.54% | -0.3% | 0% | n/a |
| Lowland Investment Company | LWI | 351.8 | 19.6% | 2.8% | 0.90% | 3.6% | 14% | ***** |
| Finsbury Growth & Income | FGT | 491.8 | 18.8% | 2.3% | 0.85% | 0.1% | 4% | ***** |
| Perpetual Income & Growth | PLI | 874.5 | 17.7% | 3.2% | 1.85% | 0.6% | 18% | ***** |
| Edinburgh Investment Trust | EDIN | 1,188.3 | 16.9% | 3.9% | 1.10% | -0.5% | 15% | ***** |
Source: Morningstar
NOTE: Past performance is not a guide to future performance and some investments need to be held for the long term.
There is also a wide range of passively-run funds which target the UK equity arena, but very few exchange-traded funds (ETFs) are dedicated to the search for income. Amundi FTSE UK Dividend Plus (ticker AUKD) and iShares UK Dividend (ticker IUKD) currently have this field to themselves, although this is likely to change, given the rise of smart beta ETFs, instruments which follow a basket of securities which are themselves selected according to a number of filters rather than membership of a benchmark index.
For the record, the Amundi instrument uses synthetic or indirect replication (derivatives) to generate the performance of the FTSE UK Dividend+ Index and comes with an ongoing charges figure (OCF) of 0.3% a year. It has just £8 million in assets. The iShares product, which has net assets of £818 million, follows the same index of the 50 highest yielding stocks in the FTSE 350 (excluding investment trusts) and has an OCF of 0.40%. It uses physical, or direct, replication, and owns the underlying securities to generate performance.
Cash in hand
Dividends tend to be a bit more predictable than earnings, as company bosses are generally reluctant to cut them – it may hit their own pocket and also attract a lot of criticism from frustrated shareholders. This means dividend yield can be one useful valuation tool, providing you have a long-enough trading history and we certainly have that for the FTSE All-Share index.
The higher the index, the lower the yield (just as is the case for a share price and a bond price), so one potential buy signal could be when the yield looks especially juicy – since that could suggest the index has fallen too far.
The current yield on the benchmark of 3.6% compares to a post-1986 average of 3.5%, to suggest minor level of undervaluation, providing the index constituents’ dividend payments prove reliable.
But this 3.6% figure beats cash hands down, using the Bank of England base rate of 0.5% as a rival benchmark. The 3.6% dividend yield also exceeds the 1.95% yield provided at the time of writing by the 10-year Government bond, or Gilt. The UK last jiggled its debt payment terms around in the 1930s (and before that in 1672) so any clients holding its debt should be able to bank the interest payments – in the form of coupons - and get back their principal, or initial investment, once the loans mature.
This chart here shows the 10-year Gilt yield over the same post-1986 period. Yields have fallen (and prices have risen) consistently.

Source: Thomson Reuters Datastream
NOTE: Past performance is not a guide to future performance and some investments need to be held for the long term.
The risk business
The catch is that shares can go down as well as up, so investors would have put their capital at much greater risk by allocating to stocks rather than cash or bonds. The question then is does the potential return from shares compensate them fully for those risks?
One way of checking this is to look at the dividend yield relative to the Gilt yield. The second chart in this piece shows the result. The gap is historically high and suggests equity valuations are attractive from a capital as well as an income perspective.
As is always the case, there are risks.
- Firms can and do cut their dividends – Glencore, Tesco, Morrison and Centrica have all done it recently and they are all well-researched FTSE 100 firms. More of that could reduce the dividend yield attraction of stocks too, so nothing can be taken for granted.
- If the Bank of England raises interest rates, bond yields are likely to rise and the gap to close, lessening the valuation attraction of stocks
This latter point again highlights the importance of interest rates and how they could influence share prices, if and when the Bank of England starts hike borrowing costs, although its chief economist Andrew Haldane now says he can even envisage a scenario where the next move is lower. In theory that would place greater emphasis on income and potentially underpin UK equity valuations following the summer correction.
Russ Mould
AJ Bell Investment Director

Written by:
Russ Mould
Russ Mould has 28 years' experience of the capital markets. He started at Scottish Equitable in 1991 as a fund manager and in 1993 he joined SG Warburg, now part of UBS investment bank, where he worked as equity analyst covering the technology sector for 12 years. Russ joined Shares in November 2005 as technology correspondent and became Editor of the magazine in July 2008. Following the acquisition of Shares' parent company, MSM Media by AJ Bell Group, he was appointed AJ Bell’s Investment Director in summer 2013.