Archived article
Please note that tax, investment, pension and ISA rules can change and the information and any views contained in this article may now be inaccurate.
The scrapping of a proposed $2 billion design for the 2020 Olympic Stadium in Tokyo and a corporate accounting scandal at the giant Toshiba conglomerate put Japan firmly back in the headlines. Even if this is not the sort of news that Prime Minister Shinzō Abe would rather not be making, his “Three Arrows” reform package continues to chime with investors, since the Japan is the best global performer on a regional basis in 2015 to date, either in local currency or sterling terms.
Japan is the best performing region in 2015 to date ...

Source: Thomson Reuters Datastream, AJ Bell Research. Returns in local currency. * 1 January to 21 July 2015.
.... in sterling terms, as well as in local currency

Source: Thomson Reuters Datastream, AJ Bell Research. Returns in sterling. * 1 January to 21 July 2015.
This enthusiasm for the Abe programme is surprising in some ways. Japan’s long-term debt and demographic problems remain as intractable as ever and the Prime Minister, plus his cohorts at the Bank of Japan, have yet to drag Japan toward their short-term targets for inflation and economic growth. At least the Japanese market does have valuation in its favour while the creation of the new Nikkei JPX-400 index adds welcome colour, as corporations look to engage more fully with shareholders, allocate capital more rigorously and improve returns. This element to the Japanese story, coupled with the Bank of Japan’s (BoJ) determination to press ahead with its Quantitative Easing (QE) programme, is supporting share prices, if not the local economy, despite the Toshiba farrago.
However, one side-effect of the Bank of Japan’s QE scheme, unintentional or not, remains weakness in the yen. This could become even more pronounced as, if and when the US Federal Reserve starts to raise interest rates. There is seemingly little chance of the BoJ tightening policy any time soon and mixed economic data mean some analysts think the central bank’s governor, Haruhiko Kuroda, may even press for an increase to QE at some stage in the second half of this year.
The last time the BoJ expanded the size of its QE scheme, the vote in favour was just 5-4 so an increase is no certainty, even if Kuroda decides it is merited. Should Japan turn to further money printing, further yen weakness could result, even if equities may offer a favourable response, as they did in April 2013 and November 2014.
As such, any investors who like the low valuations offered by Japan’s cash-rich companies may seek to hedge some of the currency exposure. The two charts above show how a decline in the yen has shaved some four percentage points off the return provided by the Nikkei 225 year-to-date. Anyone worried about further drops in the Japanese currency can take evasive action by investigating currency-hedged funds or exchange-traded funds (ETFs). These products do tend to come with a higher ongoing charge but if the yen does continue to weaken then the additional costs could prove worth it.
The first two tables look at OEICs which do and do not offer currency hedging. According to Morningstar around 17 OEICs provide this service. Although only half a dozen of them have a five-year trading history the yen has only really started to weaken since Japan (re)initiated QE in April 2013.
Best performing Japan Large Cap OEICs over the last five years
| OEIC | ISIN | Fund size £ million | Annualised five-year performance | Dividend yield | Ongoing charge | Morningstar rating |
| Atlantis Japan Opportunities | IE0033648662 | 13.4 | 18.3% | n/a | 1.92% | **** |
| Ruffer Japanese C (Acc) | GB00B846SB60 | 502.8 | 14.0% | 0.0% | 1.23% | ***** |
| Baillie Gifford Japanese B (Inc) | GB0006010945 | 914.0 | 13.8% | 0.8% | 0.68% | ***** |
| Aberdeen Japan Equity I | GB0004521737 | 518.8 | 12.3% | 0.7% | 0.87% | ***** |
| Morant Wright Nippon Yield B (Inc) | GB00B2R83B20 | 238.2 | 12.0% | 2.3% | 1.21% | ***** |
Source: Morningstar, for Japan Large Cap category, to 27 July 2015.
Where more than one class of fund features only the best performer is listed.
Best performing Japanese Currency Hedged OEICs over the last five years
| OEIC | ISIN | Fund size £ million | Annualised five-year performance | Dividend yield | Ongoing charge | Morningstar rating |
| JOHCM Japan GBP A | IE00B5LD7P60 | 684.8 | 16.5% | 0.7% | 0.84% | n/a |
| GLG Japan CoreAlpha Equity I H GBP | IE00B64XDT64 | 3,107.9 | 15.8% | n/a | 1.11% | n/a |
| Polar Capital Japan I GBP Inc | IE00B3K95D53 | 2,325.5 | 15.3% | n/a | 1.15% | n/a |
| Jupiter Japan Income I-H Inc | GB00B6496D90 | 527.3 | 15.2% | 1.5% | 1.14% | n/a |
| Legg Mason IF Martin Currie Japan Alpha X (Acc) Hedged | GB00BVZ6VC87 | n/a | 13.9% | 1.0% | 1.03% | n/a |
Source: Morningstar, for Japan Equity – Currency Hedged category, to 27 July 2015.
Where more than one class of fund features only the best performer is listed.
The next two look at ETFs. According to Morningstar just three Japanese Large Cap ETFs have a five-year performance history and no Currency Hedged products have any degree of such longevity so the tables below go back just 12 months, so investors can at least compare and contrast the performance data. The tables illustrate dollar as well as sterling hedged instruments, for illustrative purposes, to again highlight the potential importance of currency movements when it comes to investing in Japan.
Best performing Japan Large Cap ETFs over the last five years
| EPIC | Market cap £ million | Annualised one year performance | Dividend yield | Ongoing charge | Morningstar rating | Replication method | |
| db x-trackers Nikkei 225 UCITS ETF (DR) 1D USD | XDJA | 57.2 | 21.2% | n/a | 0.25% | n/a | Physical / direct |
| iShares Nikkei 225 UCITS ETF GBP | CNKY | 244.8 | 20.8% | n/a | 0.48% | ***** | Physical / direct |
| Vanguard FTSE Japan UCITS ETF | VDJP | 380.1 | 18.5% | 1.3% | 0.19% | n/a | Physical / direct |
| iShares Core MSCI Japan IMI UCITS ETF | IJPA | 801.9 | 17.3% | n/a | 0.20% | **** | Physical / direct |
| Source MSCI Japan UCITS ETF | MXJP | 38.1 | 17.3% | n/a | 0.45% | **** | Synthetic / indirect |
Source: Morningstar, for Japan Large Cap category, to 27 July 2015.
Where more than one class of fund features only the best performer is listed.
Best performing Japanese Currency Hedged ETFs over the last five years
| EPIC | Market cap £ million | Annualised one year performance | Dividend yield | Ongoing charge | Morningstar rating | Replication method | |
| db x-trackers MSCI Japan UCITS ETFF (DR) 2D USD Hedged (USD) | XMUJ | 789.7 | 41.3% | 1.4% | 0.60% | n/a | Synthetic / indirect |
| iShares MSCI Japan USD Hedged UCITS ETF | IJPD | 561.6 | 40.7% | n/a | 0.64% | n/a | Physical / direct |
| db x-trackers MSCI Japan UCITS ETF (DR) 6C GBP Hedged (GBP) | XMJG | 789.7 | 29.8% | n/a | 0.60% | n/a | Synthetic / indirect |
| UBS MSCI Japan Hedged to GBP UCITS ETF (GBP) A-acc | UC62 | 122.1 | 29.7% | n/a | 0.45% | n/a | Physical / direct |
| iShares MSCI Japan GBP Hedged UCITS ETF | IJPH | 561.6 | 29.5% | n/a | 0.64% | n/a | Physical / direct |
Source: Morningstar, for Japan Equity – Currency Hedged category, to 27 July 2015.
Progress report
Prime Minister Abe swept to power in December 2012 and immediately announced his “Three Arrows” programme, which targeted
- Huge fiscal stimulus and infrastructure spending programmes
- Huge monetary stimulus, initiated with the relaunch of QE by the Bank of Japan five months later
- Structural reform across areas such as employment law, agriculture, tax, energy and foreign direct investment
The goal was to get Japan’s economy growing again, after nearly 25 years of stagnation, and drive inflation toward the 2% target shared by the Bank of England, US Federal Reserve and the European Central Bank.
In this respect, Abenomics is yet to fully prove itself. Inflation popped higher after April 2014’s controversial consumption tax increase but progress has begun to look more modest now that has dropped out of the base for comparison. Worse still, efforts to cajole corporations to pay higher wages are not bearing fruit, so the desired virtuous circle of higher pay, higher inflation and faster spending has yet to close. Real wage growth had been negative for two years until May, when salary increases outstripped a sinking inflation figure by a measly 0.1%.
Inflation is sinking again in Japan

Source: Thomson Reuters Datastream
GDP growth remains patchy, despite the potential benefits of a weaker yen. It is possible Japan has been hampered by a slowdown in China, while the economies of Europe and the USA are still fighting to achieve escape velocity eight years after the financial crisis first broke.
Japan's GDP growth profile remains patchy

Source: Thomson Reuters Datastream, Bank of Japan
The Bank of Japan hardly seems convinced, having just cut its GDP growth forecast for the year to April 2016 from 2.0% to 1.7%. Corporations have yet to really get the feel-good factor either. The latest Tankan, or business sentiment survey, stayed stuck at a reading of seven in July, although large manufacturers showed an increase from 12 to 15 and large service firms from 19 to 23. Note how the Nikkei 225 seems to correlate with the Tankan, so more progress may be needed here if Japanese stocks are to maintain their strong run.
The Tankan Business Sentiment Survey is in positive territory ...

Source: Thomson Reuters Datastream, Bank of Japan
The latest industrial production numbers do not read well and some analysts are even wondering whether Japan’s GDP fell on a quarter-on-quarter basis between April and June. We will find out when the Q2 figure is published on 17 August.
... even if industrial production is still sluggish

Source: Thomson Reuters Datastream, Bank of Japan
Big leaps ahead
Even it is hard to conclusively argue that Abenomics is working in the real world, its power in the financial one is hard to deny for two reasons.
First, the yen has gone through the floor. This may not be tacit policy but a weak yen could help stoke both inflation and exports. The yen has plunged since Abe took office two-and-half years ago.
Abenomonics has driven the yen lower ...

Source: Thomson Reuters Datastream
Second, the stock market has boomed. The Nikkei 225 benchmark reached an 18-year high, just shy of 21,000 in late June.
...and driven the stock market to 18-year highs

Source: Thomson Reuters Datastream
Japanese stocks have responded to QE in the same way as clients and advisers have responded in Europe, the UK and US, seeking to anticipate improved growth and accelerated inflation. Abenomics has featured further ingredients, though, notably obliging the giant Government Investment Pension Fund (GPIF) to cut its weighting in bonds and shift the cash to equities. As Mark Tinker, head of AXA Framlington Asia argues, Japan is therefore obliging clients to buy stock when Europe in particular has been trying to get them to buy bonds and fund its massive sovereign debt pile.
At least Japan’s pensioners will be happy as the GPIF had its best year ever, recording a 12.3% gain in 2014. Its bond weighting has come down from 60% to 39%, when 35% is the target and its holdings in domestic equities have risen from 12% to 21%, as per the Abe plan.
Another incremental buyer is therefore required to take Japanese stocks higher. This could be the foreigner who has largely shunned the Land of the Rising Sun since its equity bubble popped in 1989. The reason for this is Japan potentially offers value at a time when it is hard to find elsewhere Tim Price of PFP Group helpfully points out in his weekly blog that roughly 70% of the US market trades on a price / book ratio above two times. Roughly 40% of the Japanese stock market trades on a ratio of less than one times. Better still, Japanese firms are cash rich with north of ¥200 trillion ($1.8 trillion) tucked away so clients who do buy stock are at least getting a degree of downside protection should something go wrong.
Better benchmarking
Abenomics is designed to get this cash moving, via investment in fixed assets and working capital, to give Japan’s economy a welcome boost. However, Japanese firms are finding other uses for it too, namely mergers and acquisitions (especially overseas), dividends and stock buybacks. The latter two reflect the creation of the JPX-Nikkei 400 index in 2014.
This benchmark is designed to attract foreign investment in particular as the constituents are hand-picked for their return on equity, dividend policy, corporate governance record and shareholder communications efforts. Japanese firms are perceived to have a patchy record in these areas and Toshiba is a member, so the billion-dollar accounting scandal here is a bit of a backward step. However, many a firm excluded from the new JPX-Nikkei 400 has jockeyed to get in to it, to get their share price going and firms like Fanuc have proved responsive to shareholder calls for increased dividends.
Whether this increased shareholder awareness has a positive effect on the broader economy is unproven. Critics would just call it financial engineering and many a US equity strategist will point out US firms are lavishing cash on dividends and buybacks but investing less in their actual business, to the benefit of their share price and detriment of total economic output.
Japanese firms have lots of cash to splash, so income hunters could look here, as payouts may grow. The rise of the JSX-Nikkei 400 also raises the issue of how best to access Japan. This column has already pointed out on several occasions how the FTSE 250 and FTSE SmallCap have left the FTSE 100 for dead this year, as they have a more propitious mix (namely less exposure to miners, oils and banks).
In theory the JPX-Nikkei 400 should have done best, given the hand-selected nature of its constituents. It was set up in January 2014 and given a starting point of 10,000 as of 30 August 2013. Yet since then, and indeed the turn of this year, the Nikkei 225 has done better, slightly to this column’s surprise.
The Nikkei 225 has outperformed since the inception of the JPX-Nikkei 400 ...
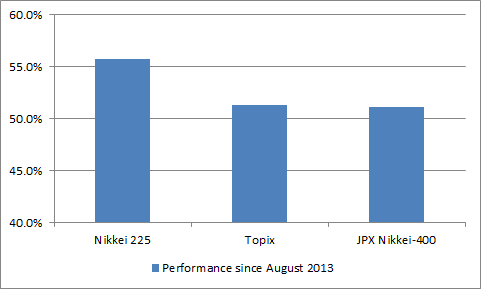
Source: Thomson Reuters Datastream
...and since the start of this year

Source: Thomson Reuters Datastream. * 1 January to 21 July 2015.
Any investor who believes better governance will win out in the end may at least be pleased to know it is possible to easily access the JPX-Nikkei 400 via ETFs. Source, Lyxor and db x-trackers all have products available.
Russ Mould
AJ Bell Investment Director

Written by:
Russ Mould
Russ Mould has 28 years' experience of the capital markets. He started at Scottish Equitable in 1991 as a fund manager and in 1993 he joined SG Warburg, now part of UBS investment bank, where he worked as equity analyst covering the technology sector for 12 years. Russ joined Shares in November 2005 as technology correspondent and became Editor of the magazine in July 2008. Following the acquisition of Shares' parent company, MSM Media by AJ Bell Group, he was appointed AJ Bell’s Investment Director in summer 2013.