Archived article
Please note that tax, investment, pension and ISA rules can change and the information and any views contained in this article may now be inaccurate.

Whether the reason is concerns over the timing of US interest rate rises, fatigue with the ongoing Greek debt drama or a simply the traditional summer lull, equities are giving up some of the ground earned during the earlier part of the year. Moreover, Emerging and Frontier markets have ceded nearly all of their gains for 2015 and Developed arenas can currently point to the best results thus far.
Even then a near-2% advance is hardly a stunning showing and more experienced advisers and clients will know that tired markets near the top of a cycle tend to gravitate toward safer, larger-cap areas as risk appetite wanes.
Developed markets have started to outperform again

Source: Thomson Reuters Datastream, from 1 January to 22 June 2015.
That said, the picture is less clear on a regional basis. Although Latin America ranks plumb last, Eastern Europe actually tops the tables, helped by a bounce in oil prices and an associated rally in Russia's equity indices. Next come Japan and the Eurozone, buoyed by aggressive quantitative easing (QE) programmes , and then Asia ex-Japan.
Japan and the Eurozone underpin developed markets performance

Source: Thomson Reuters Datastream, from 1 January to 22 June 2015
The bulk of Asia's performance, middling as it is, can be explained by a stunning surge in the Chinese equity market. Last year's darling, India, has lost momentum, at least temporarily, despite interest rate cuts from the Reserve Bank of India and high hopes for Prime Minister Narendra Modi's social and economic reforms. India is actually down for the year, in sterling terms, and only China, Hong Kong, South Korea and the Philippines have recorded gains in 2015.
China and Hong Kong lead the way in Asia, where most markets are struggling
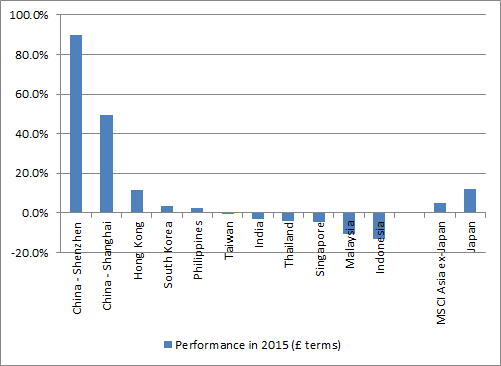
Source: Thomson Reuters Datastream, from 1 January to 22 June 2015
It would be difficult for any adviser or client to finesse these trends to maximise returns and minimise risk, especially as China's economy and markets are performing in a way rarely seen before. Domestic stocks are leading the charge, as evidenced by the outperformance of Shenzhen relative to Shanghai. Premier Li Keqiang tries to shift the economy away from construction and exports and toward consumption. This means Western-quoted 'China proxies' like mining stocks are still finding the going tough, while a crackdown on graft means luxury names are finding the going tougher (albeit through no fault of their own as their products were often used as gifts). Meanwhile price onslaughts from local suppliers, valuation concerns and the occasional scandal, such as that concerning noodles in India, are weighing on names like the UK's Unilever or Switzerland's Nestlé.
With the usual proxies failing to deliver and the local eddies and cross-currents hard to follow, this is where a good fund manager who is an expert in Asian equities will be looking to add value.
Best performing Asia-Pacific ex-Japan OEICs over the last five years
| OEIC | ISIN | Fund size £ million | Annualised five- year performance | Dividend yield | Ongoing charge | Morningstar rating |
| Baillie Gifford Pacific B (Acc) | GB0006063233 | 339.4 | 9.8% | 0.7% | 0.70% | **** |
| Investec Asia ex-Japan I (Acc) Net | GB00B1XFJD49 | 174.7 | 9.1% | 1.1% | 1.03% | ***** |
| First State Asian Growth Fund I (Acc) | IE0008368411 | 403.8 | 9.1% | n/a | 1.61% | **** |
| Schroder Asian Alpha Plus Z (Acc) | GB00B5BG4980 | 619.6 | 8.7% | 0.9% | 0.94% | **** |
| Allianz Total Return Asian Equity C (Inc) | GB00B1FRQV53 | 49.4 | 8.1% | 1.3% | 1.38% | **** |
Source: Morningstar, for Asia-Pacific ex-Japan category, to 22 June 2015.
Where more than one class of fund features only the best performer is listed.
Best performing Asia-Pacific investment companies over the last five years
| Investment company | EPIC | Market cap (£ million) | Annualised five-year performance * | Dividend Yield | Ongoing charges ** | Discount to NAV | Gearing | Morningstar rating |
| Aberdeen Asian Smaller Companies | AAS | 313.9 | 14.6% | 1.6% | 1.46% | -10.3% | 8% | ***** |
| Scottish Oriental Smaller Companies | SST | 252.2 | 13.9% | 1.4% | 1.35% | -11.1% | 0% | ***** |
| Pacific Assets | PAC | 230.2 | 13.1% | 1.3% | 2.11% | 1.0% | 0% | **** |
| Schroder Oriental Income | SOI | 428.0 | 12.5% | 4.0% | 1.34% | 0.7% | 3% | ***** |
| Invesco Asia | IAT | 173.4 | 10.1% | 1.8% | 1.06% | -8.6% | 0% | ***** |
Source: Morningstar, The Association of Investment Companies, for the Asia Pacific, ex-Japan category, to 22 June 2015. * Share price. ** Includes performance fee
Those clients willing to take a longer-term view, and prepared to back demographic trends, the growth of the middle-class and rising wealth, with the additional potential of economic and social reform plus new trade agreements on top, there are passive funds which will provide broad-brush exposure. Here, advisers and clients need to check on the make-up of the underlying index tracked, especially as this may tilt further toward China over time as market reforms increase liquidity and foreign ownership quotas and raise the prospect of greater weightings in pan-regional benchmarks such as those provided by MSCI or FTSE.
Best performing Asian ETFs over the last five years
| EPIC | Market cap £ million | Annualised five year performance | Dividend yield | Total expense ratio | Morningstar rating | Replication method | |
| iShares MSCI AC Far East ex-Japan Smaller Cap | IDFE | 50.5 | 6.7% | 2.0% | 0.74% | **** | Physical / direct |
| db X-trackers MSCI Pacific ex-Japan UCITS ETF 1C GBP | XPXJ | 413.0 | 5.9% | n/a | 0.50% | **** | Synthetic / indirect |
| iShares MSCI Pacific ex-Japan UCITS ETF (Dist) USD | IPXJ | 252.2 | 5.9% | n/a | 0.60% | **** | Physical / direct |
| db X-trackers MSCI AC Asia ex-Japan Index UCITS ETF 1C | XAXJ | 651.4 | 4.8% | n/a | 0.50% | *** | Synthetic / indirect |
| db X-trackers MSCI EM Asia Index UCITS ETF 1C GBP | XMAS | 591.4 | 4.0% | n/a | 0.65% | *** | Synthetic / indirect |
Source: Morningstar, for the Asia Pacific ex-Japan Equity and Asia ex-Japan Equity categories, to 22 June 2015.
Where more than one class of fund features only the best performer is listed.
The Big Three
Thailand, Singapore and Taiwan are all teetering on the brink of deflation, with consumer price index (CPI) readings falling year-on-year. Meanwhile Thailand's long-awaited elections may be delayed by the generals in charge yet again, until 2016, Indonesia's great hope, Indonesia's President Joko Widodo is yet to fully deliver on long-awaited reforms, while Malaysia's prime minister Najib Razak is fighting off a graft scandal. Most tellingly, the dollar remains a key driver of sentiment toward Asia Pacific equity and bond markets. While sovereign nations have taken on the harsh lessons of 1997-98's debt and currency crises, many corporates have been tempted by record-low interest rates to borrow heavily in dollars. Were the buck to rise in value these debts become more expensive to service. If – and it remains a big ‘if’ – the US raises interest rates and sends the dollar soaring, emerging markets could suffer, if historic market action is any guide.
There is a strong historic inverse correlation between the dollar and emerging market equities

More positively, Asia's three real economic big-hitters, China, India andJapan, all offer the prospect of economic, social and financial market reform. Prime Minister Narendra Modi in India, Prime Minister Shinzō Abe in Japan and Premier Li Keqiang in China are all trying to drive through wide-ranging packages and the financial markets have (generally) welcomed these initiatives with open arms.
This chart shows India’s BSE Sensex since Modi was elected in in May 2014, although it should be noted the benchmark had already begun to gallop higher as it sensed a victory for the Bharatiya Janata Party and a crushing loss for Rahul Gandhi's incumbent Indian National Congress.
Indian stocks welcomed Prime Minister Modi's election win

Source: Thomson Reuters Datastream
Here we see Japan’s Nikkei 225 since Abe swept to power in a landslide election win just before Christmas 2012.
Japanese Prime Minister Shinzō Abe has galvanised the Nikkei 225

Source: Thomson Reuters Datastream
China’s Shanghai Composite (on the left) and the Shenzhen Composite (on the right) have both thrived since Li Keqiang took the post of Premier on in March 2013.
Chinese equities have warmed to Premier Li Keqiang's reforms

Source: Thomson Reuters Datastream
China syndrome
That said, China's one-week, 13% tumble in mid-June was its worst five-day showing since the dark days of 2008. This is prompting fears that a bubble may be about to burst, especially as new account openings and margin debt suggest private individuals have just started to pile into the market – something that is not always a good sign.
The Chinese authorities seem to be alert to this danger, as they keep tightening margin requirements to calm some of the frenzy. To ascertain whether the wobble was just that or the harbinger of something more serious it may be worth looking at why Shanghai and Shenzhen have soared higher to see if these trends can continue to provide support:
- First, these indices are motoring despite clear signs of a slowdown in Chinese GDP growth. Beijing may publish around 7% growth this year but no-one believes it, looking at underlying indicators like rail traffic, bank credit and electricity consumption. However, the central bank keeps cutting interest rates and just as in Japan and Europe cheaper money is ending in up stocks as investors look for returns
- Second, as already noted, this economic slowdown may be occurring for a good reason and one that will bring long-term benefits. Premier Li is looking to rebalance the economy away from construction toward consumption to create a healthier outlook.
- Third, the huge new Silk Road investment programme spans Asia and could help boost Chinese trade
- Finally, the Hong Kong-Shanghai Connect scheme is designed to boost stock market flow and overseas interest. Hong Kong-Shenzhen is coming and increased liquidity means Chinese mainland stocks may one day end up in the MSCI benchmarks. According to some analysts inclusion could create $50 billion worth of interest from tracker funds alone – not a small sum in the context of the mainland market cap, which is around $4 trillion according to Citigroup.
Political prowess
India is also targeting huge change, even if the market may have priced at least some of it in. The BSE Sensex ran up as a Modi election victory began to look likely and after an initial honeymoon period he now has to deliver. As Mark Tinker, Asian equity strategist at AXA Investment Management points out, Japanese equities suffered a similar initial rise and fall under prime minister Abe before he began to implement rather than just talk about change.
This is not to say Abe is having everything go his way. Japan still has huge debt problems, rotten demographics and is nowhere near the Bank of Japan’s 2% inflation target, despite its huge QE programme, which is currently scheduled to run at ¥80 billion a month until further notice is given.
Economic momentum is also patchy. The Tankan – or The Short-Term Economic Survey of Enterprises of Japan - will offer the latest insight into the Japanese economy on Tuesday 30 June. In March the corporate sentiment reading rose from five to seven overall and stayed flat at 12 for large manufacturers. The Nikkei has a close relationship to this sentiment indicator over the long term so the latest Tankan should make for interesting reading.
The Tankan and Nikkei 225 index have a good historic correlation

Source: Thomson Reuters Datastream
Currency conundrum
One area where Abe has had a material impact is upon the yen. It has plunged since the Bank of Japan relaunched QE on 4 April 2013, though whether this is good news for everyone remains to be seen. It may help Japanese exporters, but their rivals are less likely to welcome such currency manipulation. South Korea for one may be feeling the pinch.
This first graphic shows there is a good historic link between yen weakness against the Korean won and the Nikkei 225.
Japanese stocks are basking in yen weakness relative to the won...

Source: Thomson Reuters Datastream, AJ Bell Research
The second shows the Korean KOSPI benchmark is doing its best to shrug off the won's rise against the Japanese counter, but gravity may now be taking hold. The Bank of Korea has already cut interest rates twice this year, taking heading borrowing costs to a record-low 1.5%. Even if the last move was deemed to be a response to an outbreak of the Mers virus, the central bank may have also had plans to weaken the won in mind.
...while Won strength may be weighing on the Korea's KOSPI benchmark

Source: Thomson Reuters Datastream, AJ Bell Research
Given the importance of currency movements, some clients may wish to hedge out this variable so they can concentrate on the others. For what is usually a slightly higher total expense ratio in the case of ETFs or ongoing charge in the case of funds, it is possible to buy collectives which iron out forex effects and deliver sterling-denominated returns.
For Asia ex-Japan, there are three funds, although all are less than two years old, according to Morningstar data. They are BlackRock Global Funds China D2RF, New Capital China Equity and Hermes Asia Ex-Japan Equity. The only ETF which does this targets only the Australian market.
For Japan only, there is a wider range of choice, both active and passive. Five active funds even have a five-year history, namely JOHCM Japan, GLG Japan Core Alpha Equity, Polar Capital Japan, Martin Currie Japan Alpha and Schroder Japanese Equity. There is also a good selection of currency-hedged ETFs for Japan, although only db X-trackers MSCI Japan Index (GBP-hedged) and iShares MSCI Japan EUR Hedged can boast a trading history of greater than three years. This pair have offered annualised returns of 30.5% and 24.5% over three years, compared to 15% from the top-performing unhedged ETF, iShares Nikkei 225, and 26.9% from the best unhedged active fund, Atlantis Japan Opportunities.
Equally, clients may take the view that second-guessing the currency and paying higher fees are something they can do without, but given Japan's and China's long term plans for the yen and yuan, forex may well have an important bearing on returns from Asia for some time to come.
Russ Mould
AJ Bell Investment Director

Written by:
Russ Mould
Russ Mould has 28 years' experience of the capital markets. He started at Scottish Equitable in 1991 as a fund manager and in 1993 he joined SG Warburg, now part of UBS investment bank, where he worked as equity analyst covering the technology sector for 12 years. Russ joined Shares in November 2005 as technology correspondent and became Editor of the magazine in July 2008. Following the acquisition of Shares' parent company, MSM Media by AJ Bell Group, he was appointed AJ Bell’s Investment Director in summer 2013.