Archived article
Please note that tax, investment, pension and ISA rules can change and the information and any views contained in this article may now be inaccurate.

Equity indices as diverse as America's Dow Jones Industrials and NASDAQ Composite, the UK's FTSE 100 and FTSE 250, Germany's DAX, Israel's TA-25 and Sweden's OMX-30 have reached new peaks in 2015, while Japan's Nikkei 225 stands at an 18-year high and China's Shanghai Composite at levels last seen some five years ago.
As such, the bulls seem to be in charge, especially as equities are handily outpacing bonds, (precisely as the consensus predicted they would back at the start of the year).
Equities are outperforming bonds in 2015

Source: Thomson Reuters Datastream, AJ Bell Research. Total returns in £ terms.
Moreover, it is the riskier areas that are generally doing best within equities. Emerging Markets are bouncing back after a couple of years in the doldrums, with China and Russia leading the way.
Riskier equity arenas are leading the charge

Source: Thomson Reuters Datastream, AJ Bell Research. Total returns in £ terms.
Russia's renaissance, perhaps partly fuelled by a rally in oil and cuts in interest rates, puts Eastern Europe at the top of the pile so far this year, in local currency and sterling terms, although Japan and Western Europe are not far behind, where Quantitative Easing programmes mean monetary policy is running fast and loose.
Loose monetary policy looks to be leading equities higher
.png)
Source: Thomson Reuters Datastream, AJ Bell Research. Local currency terms.
This is all a great contrast to America, where the S&P 500 is a laggard in 2015 and economic momentum appears to be weak. Last week's substantial downgrade to America's first-quarter GDP growth figure, from 0.2% to -0.7%, at least meant this column's previous missive (see here) was timely, in the questions it asked about just exactly how robust the US economy really is. Without wishing to sound like a cracked record, it may be worth revisiting America this week, at least briefly, given the intriguing divergence between the Dow Jones Industrials index and its lesser-known sibling, the Dow Jones Transportation benchmark.
While past performance is no guarantee for the future, any such divergence in the past has tended to warn of an economic slowdown or a broader equity market retreat or both. As such investors cannot afford to be complacent, even if the market rhythm right now suggests risk-taking is still very much in vogue.
Breakdown in the Dow Transports index needs to be watched

Source: Thomson Reuters Datastream
One track mind
The 30-stock Dow Jones Industrials features corporate giants like Apple, Walt Disney, Nike, GE and Microsoft. The 20-stock Transport index consists of five airlines, four trucking firms, four rail-roads and three delivery services firms, among others.
Richard Russell's Dow Theory argues it must be good news if the share prices of the firms shipping goods around America are doing as well or better than those of the firms making them, as this suggests business is strong. If something is sold, it has to be moved on and shipped. By contrast, if the Transports are doing badly then there is a chance manufacturers are doing less well, orders are slowing and maybe even that inventory is building.
At the moment, the vibes from the Transportation index are not particularly encouraging and history suggests we must all pay attention at such times. The next chart shows how the relationship between the Dow Jones Industrials and Dow Jones Transports developed ahead of the 2007 to 2009 bear market is US equities.
Dow Transports index came off the rails in 2007….
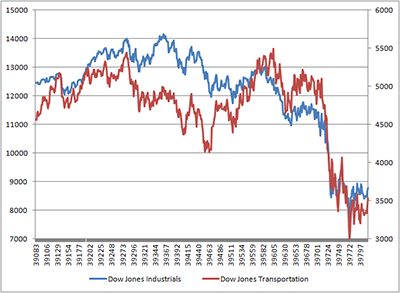
Source: Thomson Reuters Datastream
The Transportation index broke down in summer 2007, just the first signs of distress in the sub-prime debt market first appeared. Neither it nor the Industrials recovered until the market bottomed in early 2009. The next graphic then shows how Transports and Industrials have advanced pretty much in lock-step during the six-year bull run – until the last three months that is.
…. then helped take the market higher as it recovered in 2009
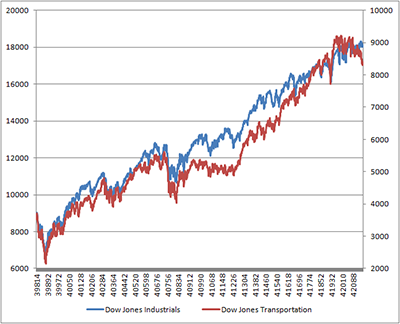
Source: Thomson Reuters Datastream
Chilly spring
In some ways this should not be an enormous surprise. First-quarter GDP was much weaker than expected and the slowdown in the Transports index could also dovetail with the Atlanta Fed's GDP now forecast for the second quarter of just 0.8% growth. That is hardly a sharp rally given that poor January-to-March number.
US GDP shrank in the first quarter...
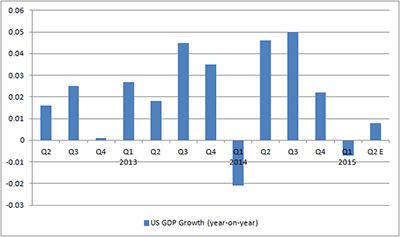
Source: Thomson Reuters Datastream, Atlanta Fed Estimate
The Atlanta Fed's view is much more bearish than the consensus but it does fit with the action we are seeing in the Transports index and also some data from the St. Louis Federal Reserve.
….and inventory build could mean second quarter is quiet too
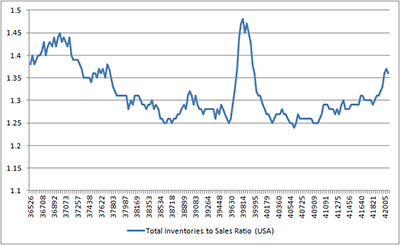
Source: St. Louis Federal Reserve (FRED)
This shows how the inventory to sales ratio for US corporations is creeping higher and now stands at a level last seen in 2002 and 2008, or in other words the last two recessions.
Benchmark bother
Given the development of such interesting trends in the Transports versus the Industrials on the other side of the pond, it is tempting to look at whether anything can be learned from the equivalent benchmarks here in the UK. There used to be a good apparent correlation between the FTSE All-Share and the FTSE All-Share Industrial Transportation indices:
UK Transportation index looks less useful now...
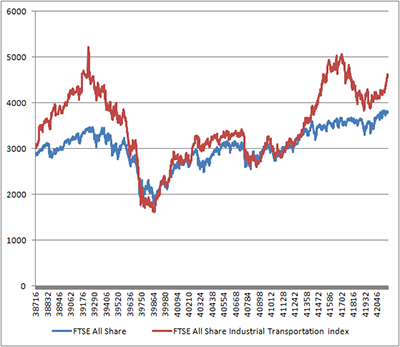
Source: Thomson Reuters Datastream
However this relationship began to break down in 2013. This may be due to FTSE's less-than-brilliant idea to include Royal Mail in the Industrial Transport index as the FTSE 100 firm now dominates the sector benchmark, as could be expected given its huge market cap.
…given the influence of Royal Mail plc

Source: Thomson Reuters Datastream
This leaves me casting around for a similar chart or useful indicator of sentiment and economic progress. Small caps offer some guide to market risk appetite and the picture here is encouraging both here and in the USA.
Small cap strength suggests risk appetite is high...

Source: Thomson Reuters Datastream
….in the UK and USA
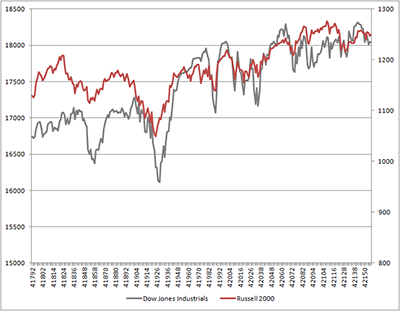
Source: Thomson Reuters Datastream
A rally in high yield (junk) bonds in the US, as benchmarked two by New York-listed Exchange-Traded Funds, also speaks of elevated appetite for risk, as does a strong run in our old friend the Philadelphia Semiconductor Index (the SOXX). This benchmark has been buoyed by rampant merger and acquisition activity, notably Intel's $16 billion bid for Altera and Avago's $37 billion lunge for Broadcom.
High yield debt is rallying….
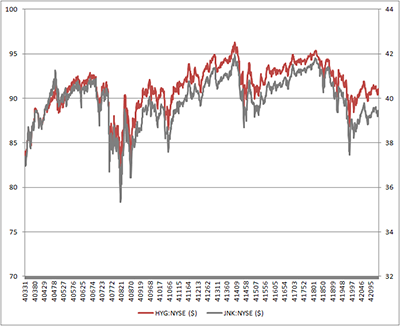
Source: Thomson Reuters Datastream
….and chip stocks are also flying….
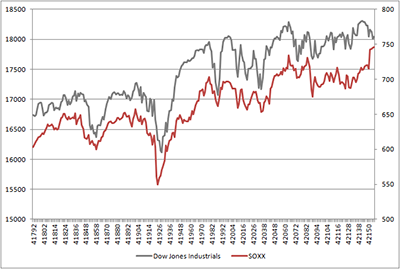
Source: Thomson Reuters Datastream
Less pleasing to the eye is a renewed slide in the economic bellwether than is copper, where a spring rally is proving short-lived.
….although Doctor Copper looks less healthy
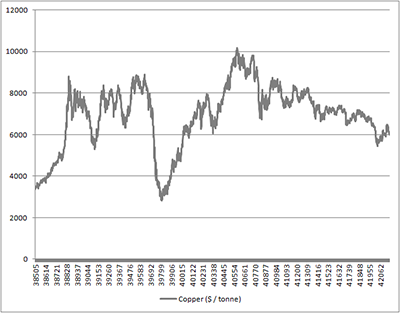
Source: Thomson Reuters Datastream
In central banks we trust
Bear markets only tend to ensue when substantial earnings disappointments, a loss of economic momentum or rising interest rates (or a combination of all three) catch up with an overvalued market.
Whether the US is overvalued or not remains a subject of fierce debate but most markets tend to overshoot historic norms in bull runs. The economy and earnings momentum may be hitting a flat spot, as suggested last week and that leaves interest rates to take some of the strain. Under such circumstances the US Federal Reserve is unlikely to raise interest rates when it meets on 16-17 June, even if chair Janet Yellen continues to talk about tighter policy and the market still thinks a rate hike may be coming in September, or December at the latest.
Russ Mould
AJ Bell Investment Director

Written by:
Russ Mould
Russ Mould has 28 years' experience of the capital markets. He started at Scottish Equitable in 1991 as a fund manager and in 1993 he joined SG Warburg, now part of UBS investment bank, where he worked as equity analyst covering the technology sector for 12 years. Russ joined Shares in November 2005 as technology correspondent and became Editor of the magazine in July 2008. Following the acquisition of Shares' parent company, MSM Media by AJ Bell Group, he was appointed AJ Bell’s Investment Director in summer 2013.
Related content
- Wed, 17/04/2024 - 09:52
- Tue, 30/01/2024 - 15:38
- Thu, 11/01/2024 - 14:26
- Thu, 04/01/2024 - 15:13
- Fri, 17/11/2023 - 08:59