Archived article
Please note that tax, investment, pension and ISA rules can change and the information and any views contained in this article may now be inaccurate.

All of them are back on the dividend list, three are already buying back shares and the sector ranks as the third-best performer within the FTSE 350 in the year to date, so next week’s results from the Big Five banks will be a key test of their apparent return to favour, and whether it can last. All of this quintet are due to report first-quarter earnings next week, starting with HSBC on Tuesday 27th April and finishing with Barclays and NatWest on Friday 30th.
| FTSE 350 banks index | |||||
|---|---|---|---|---|---|
| 2021 to date | Last year | Last 3 years | Last 5 years | Last 10 years | |
| Performance | 15.5% | 25.7% | (34.2%) | (13.5%) | (42.6%) |
| Ranking | 3 | 21 | 37 | 32 | 38 |
Source: Sharepad. Capital returns only. Based on the 40 FTSE 350 sectors.
The four Main Street banks in America blew away earnings estimates, thanks to the combination of an economic recovery, booming financial markets and the reversal of some of last year’s loan loss provisions. Between them, Bank of America, Citigroup, JP Morgan Chase and Wells Fargo racked up net profits of $35 billion, declared dividends worth $5.8 billion and bought back $11 billion of stock in the first quarter of this year, to suggest they feel the worst of the pandemic is behind them.
| Big Four Main Street US banks | |||||
|---|---|---|---|---|---|
| Q1 2020 | Q2 | Q3 | Q4 | Q1 2021 | |
| Net income ($ billion) | 9.5 | 6.6 | 19.2 | 24.6 | 34.7 |
| Dividends ($ billion) | 7.5 | 7.5 | 5.7 | 5.8 | 5.8 |
| Buybacks ($ billion) | 19.1 | 0.4 | 0.1 | 0.3 | 11 |
Source: Company accounts - Bank of America, Citigroup, JPMorgan Chase and Wells Fargo
A key factor was lower loan loss provisions. All four now think that they were too conservative in 2020 and over-provisioned for potential loan losses, with the result that they wrote back some of those provisions in the first quarter. That added $9 to profits between them and thus represented a big chunk of the overall profit advance – the Main Street quartet took $60 billion of loan write-downs across 2020, including $24 billion in the first quarter alone.

Source: Company accounts
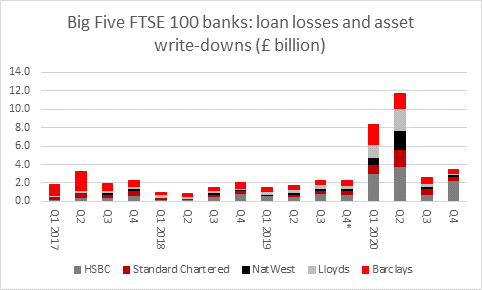
Lower loan losses and provision write-backs could work to the benefit of the FTSE 100’s Big Five, too. The swallowed loan and other asset write-downs to the tune of £7.5 billion in Q1 last year but that figure had dwindled to £2.8 billion by Q4 and it will be interesting to see if they feel confident enough to write anything back for the January to March period.
Source: Company accounts. *Excludes $7.4 billion goodwill impairment at HSBC in Q4 2019
Two more factors will exert a major influence on the FTSE 100 lenders’ earnings.
The first is loan growth. This had begun to build up a head of steam in late 2019 and early 2020, only for the pandemic to hit home. Customers then headed for cash and built up deposits, so it will be interesting to see if demand for credit – and willingness to offer it – is back on the rise as the economy begins to unlock once more and vaccination programmes continue. Note however that the aggregate loan book across the Big Five came to £2.1 trillion at the end of 2020 compared to £2.2 trillion at the start of 2013. Even if this is partly down to disposals and changes in group structures, this overall lack of growth points to the highly indebted nature of the UK (and many other key markets) and competition from challenger and fintech rivals, both of which are long-term challengers for the established FTSE 100 lenders.

Source: Company accounts - Barclays, HSBC, Lloyds, NatWest and Standard Chartered
The second is net interest margin. The banks’ lending margins have been crushed by the combination of record-low interest rates and the effects of Quantitative Easing, which has been used buy central banks to lower borrowing costs and flatten the yield curve. Bond yields rose in Q1 2021 as markets looked toward a strong economy and even the first stirrings of inflation and this may have offered some welcome respite to the Big Five as well.
| Net interest margin (%) | |||||
|---|---|---|---|---|---|
| 2016 | 2017 | 2018 | 2019 | 2020 | |
| Barclays UK | 3.62% | 3.49% | 3.23% | 3.09% | 2.61% |
| HSBC | 1.73% | 1.63% | 1.66% | 1.59% | 1.32% |
| Lloyds | 2.71% | 2.86% | 2.93% | 2.88% | 2.52% |
| NatWest | 2.18% | 2.13% | 2.09% | 1.99% | 1.71% |
| Standard Chartered | 1.55% | 1.6% | 1.69% | 1.62% | 1.31% |
Source: Company accounts
In the case of Barclays, attention will also focus on the investment bank and whether it has cashed in on the equity markets’ ongoing bull run, volatility in fixed income and the surge in global equity issuance and merger and acquisition activity. Any sign of poor performance, in absolute terms of relative to global peers, could yet see Sherborne Investors and Mr Edward Bramson return to apply fresh pressure on Jes Staley and Barclays’ board with regard to the role of the investment bank and the amount of capital it is allocated within the wider group.
Overall, earnings estimates are moving higher at the Big Five and the first-quarter results will be important in maintaining that momentum. For 2021 as a whole, analysts expect aggregate pre-tax profit to more than double to £25 billion and then go higher again in 2022, while dividends are expected to rebound to £7 billion after last year’s pause owing to the pandemic and regulatory requirements – though both profits and dividends are only expected to return to 2019’s pre-pandemic levels in 2022.

Source: Company accounts - Barclays, HSBC, Lloyds, NatWest and Standard Chartered; consensus analysts’ forecasts; Marketscreener; Sharecast
Even once the Big Five shake off the pandemic, they still have to grapple with ever-tighter regulation, fintech rivals and the way in which global indebtedness could crimp demand, as well as the prospect of lower-for-longer interest rates weighing on margins. All of these factors explain why the FTSE 100 banks continue to trade below book (or net asset) value.
| 2021E | Q4 2020 | 2021E | 2021E | |
|---|---|---|---|---|
| P/E | Price/book | Dividend yield | Dividend cover | |
| Lloyds | 10.8 x | 0.83 x | 4.0% | 2.29 x |
| NatWest | 21.8 x | 0.75 x | 5.1% | 0.90 x |
| HSBC | 16.6 x | 0.72 x | 3.8% | 1.59 x |
| Barclays | 11.0 x | 0.69 x | 2.9% | 3.09 x |
| Standard Chartered | 13.1 x | 0.50 x | 2.7% | 2.83 x |
Source: Company accounts, consensus analysts’ forecasts, Marketscreener, Refinitiv data
| 2020 | ||||
|---|---|---|---|---|
| Net interest | Return on | CET1 | Leverage | |
| Margin | Tangible equity | Ratio | Ratio | |
| Lloyds | 2.42% | 2.3% | 16.2% | 5.8% |
| NatWest | 1.71% | (2.4%) | 18.2% | 6.2% |
| HSBC | 1.32% | 3.1% | 15.9% | 5.5% |
| Barclays | 2.61% | 3.2% | 15.1% | 5.3% |
| Standard Chartered | 1.23% | 1.3% | 14.4% | 5.2% |
Source: Company accounts
To persuade investors that their shares offer value – and are not simply value traps – the lenders must demonstrate that they can sustainably improve returns on equity or that the asset valuations are completely reliable. A drop in asset impairments in the coming year would at least help on the latter front, as the US banks have proved. Shares in the four US Main Street banks all trade at premiums to book value, helped by their phenomenal returns on equity, and ultimately the FTSE 100 banks need to improve their returns, too, if their shares are to make sustained gains over the long term.
| 2021E | Q1 2021 | 2021E | 2021E | |
|---|---|---|---|---|
| P/E | Price/book | Dividend yield | Dividend cover | |
| Citigroup | 8.1 x | 1.01 x | 2.9% | 4.29 x |
| Wells Fargo | 11.8 x | 1.30 x | 1.2% | 6.91 x |
| Bank of America | 13.2 x | 1.87 x | 1.9% | 3.91 x |
| JP Morgan | 11.6 x | 2.29 x | 2.4% | 3.59 x |
Source: Company accounts, consensus analysts’ forecasts, Marketscreener, Refinitiv data
| Q1 2021 | ||||
|---|---|---|---|---|
| Net interest | Return on | CET1 | Leverage | |
| Margin | Tangible equity | Ratio | Ratio | |
| Citigroup | 1.95% | 17.2% | 11.7% | 7.0% |
| Wells Fargo | 2.06% | 12.7% | 11.8% | 7.9% |
| Bank of America | 1.68% | 17.1% | 13.0% | 7.2% |
| JP Morgan | 1.64% | 29.0% | 13.1% | 6.7% |
Source: Company accounts
These articles are for information purposes only and are not a personal recommendation or advice.

Written by:
Russ Mould
Russ Mould has 28 years' experience of the capital markets. He started at Scottish Equitable in 1991 as a fund manager and in 1993 he joined SG Warburg, now part of UBS investment bank, where he worked as equity analyst covering the technology sector for 12 years. Russ joined Shares in November 2005 as technology correspondent and became Editor of the magazine in July 2008. Following the acquisition of Shares' parent company, MSM Media by AJ Bell Group, he was appointed AJ Bell’s Investment Director in summer 2013.
Related content
- Wed, 17/04/2024 - 09:52
- Tue, 30/01/2024 - 15:38
- Thu, 11/01/2024 - 14:26
- Thu, 04/01/2024 - 15:13