Archived article
Please note that tax, investment, pension and ISA rules can change and the information and any views contained in this article may now be inaccurate.

The NASDAQ Composite’s second worst daily decline of the year, and its third one-day slide of more than 2%, may be a further sign that investors’ love affair with technology stocks is just cooling a little as they look for ways to play a post-pandemic upturn.
Gathering concern over inflation, as wage growth accelerates, commodity prices surge and bond yields grind higher, also helps to explain the apparent switch in preference from secular growth plays like tech to cyclical growth and recovery plays – or ‘value’ stocks, for want of a better turn of phrase. Investors need to think long and hard about this, as a continuation of this trend could have huge implications for asset allocation and the performance of the stocks and funds in their portfolios.
There are many ways to (crudely) measure how ‘value’ and ‘growth’ stocks are performing relative to each other but judging the relative performance of small caps against large caps is one way to do it. Two huge US-quoted exchange-traded funds make this quick and easy to do.

Source: Refinitiv data
The Invesco QQQ Trust is designed to track the performance of the NASDAQ Composite’s index’s largest 100 non-financial companies and deliver that performance to investors, minus its running costs. The QQQ has $155 billion in assets under administration and its biggest holdings are Apple, Microsoft, Amazon, Alphabet, Tesla, Facebook and NVIDIA. It is therefore a good proxy for ‘growth’ and those firms whose business models have thrived during the pandemic.
In the opposite corner we have the iShares Russell 2000 Value ETF. It has $14 billion of assets under management and follows a basket of nearly 1,500 stocks that offer ‘value’ characteristics. Two-thirds of the portfolio lies in the financials, industrials, consumer discretionary and real estate sectors – against barely 20% in the QQQ – and it has just 7% in technology, against 49% in the QQQ.
Since the start of autumn 2014, when the NYSE FANG+ index was launched and the technology stocks and the FAAANM sextet of Facebook, Alphabet, Amazon, Apple, Netflix and Microsoft really began to come into its own, the Invesco QQQ is up by 223% and the iShares Russell 2000 Value ETF by 57%.
But the iShares Russell 2000 Value ETF has been making stealthy progress of late. Since Pfizer Monday it has gained 33% while the QQQ is up just 12%, the ‘value’ tracker has surged by 61% compared to 29% advance from the QQQ.
In other words, even when it looked like tech and social media stocks were the only game in town during the second half of 2020, when they continued to post bumper earnings figures and the economic outlook seemed bleak, value and recovery plays were taking the lead.
This can be shown by dividing the price of the Invesco QQQ Trust by the price of the iShares Russell 2000 Value ETF.
If the line goes up, the QQQ is outperforming and if it goes down then the ‘value’ tracker is outperforming.

Source: Refinitiv data
The question now for investors is whether this is ‘it’ and the long-awaited return of value relative to growth or not.
After all, ‘value’ beat ‘growth’ hands down from 2000 to 2007 as the tech, media and telecoms bubble collapsed and TMT stocks’ lofty valuations proved unsustainable. Tech and ‘growth’ began to gently assert themselves in the wake of the great financial crisis and really came into their own from 2014 onwards.

Source: Refinitiv data
However, even the most ardent growth fan may pause for thought when they see that the differential in performance between ‘growth’ and ‘value’ at the peak last summer, as defined by the Invesco QQQ and the iShares Russell 2000 Value ETF, was greater than it was even in 2000 and the tail end of the tech bubble.
This may partly explain the violent outperformance of cyclicals and value names relative to growth plays post the Pfizer announcement and why value has been stealthily outperforming since as far back as July.
Granted, there have been failed rallies in value before – Q4 2019 was a recent example – so investors will now have to weigh up what could favour ‘value’ or ‘growth’ going forward.
Valuation alone is never a catalyst for out- or –underperformance, but it is the single biggest determinant of long-term investment returns (and a decade seems like a suitable definition of long-term). If tech earnings keep growing and surprising on the upside, if interest rates stay low, if inflation stays subdued and the Facebooks and Apples of this world use the combination of product innovation and acquisitions to maintain and even deepen their powerful competitive advantages, then many investors will be tempted to dismiss valuation as an irrelevance and stick with ‘growth’.
But the trouble could start if regulators begin to take a hand, earnings disappoint (as Big Tech does not prove to be immune to the pandemic after all or the law of large numbers means it simply becomes harder to generate strong percentage growth figures) or the wider economy starts to accelerate and inflation picks up.
If a covid-19 vaccine is quickly and successfully distributed, then stocks which are seen as ‘immune’ from the pandemic may be less in demand and seen as less worthy of a premium valuation.
Equally, if growth and inflation pick up, then investors may not be so inclined to pay such premium multiples for ‘growth’ companies, if rapid earnings increases can be acquired much more cheaply along downtrodden value, cyclical plays like industrials, financials and consumer discretionary plays.
Moreover, an increase in inflation could force Government bond yields higher, even if central banks decline to raise interest rates and let inflation run hot, as per the US Federal Reserve’s new ‘average’ inflation target. This has been particularly noticeable this week, in the wake of Pfizer’s covid vaccine trial, as the US 10-year Treasury yield has moved back toward 1% for the first time since March.

Source: Refinitiv data
Prior periods of rising 10-year US Treasury yields have coincided with attempted rallies in ‘value’ names, so perhaps a return to economic growth and inflation could be the trigger for a sustained period of underperformance from ‘growth’ and ‘tech’ stocks relative to value ones.
And while the concept of rising inflation may seem fanciful for now, investors should not forget that this is what central banks and Governments crave to help the globe manage its crushing debts, so they may stop at nothing until they get it. The latest money supply growth figures from the USA in particular are eye-popping and should be followed closely as a potential lead indicator.
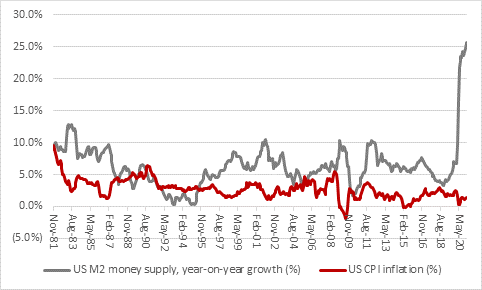
Source: FRED – St. Louis Federal Reserve database
These articles are for information purposes only and are not a personal recommendation or advice.

Written by:
Russ Mould
Russ Mould has 28 years' experience of the capital markets. He started at Scottish Equitable in 1991 as a fund manager and in 1993 he joined SG Warburg, now part of UBS investment bank, where he worked as equity analyst covering the technology sector for 12 years. Russ joined Shares in November 2005 as technology correspondent and became Editor of the magazine in July 2008. Following the acquisition of Shares' parent company, MSM Media by AJ Bell Group, he was appointed AJ Bell’s Investment Director in summer 2013.