Archived article
Please note that tax, investment, pension and ISA rules can change and the information and any views contained in this article may now be inaccurate.
“Barclays is resuming dividend payments and adding to the 1p-a-share payment with a £700 million share buyback, the equivalent of a further 4p a share in cash, but the shareholders seem a little underwhelmed,” says Russ Mould, AJ Bell Investment Director.
“The headline profit figures were better than expected and the balance sheet looks robust, according to key regulatory ratios, but the outlook statement is cautious and understandably packed with caveats. This may be why Barclays is taking baby steps when it comes to dividends and leaning towards a buyback, as the latter mechanism is more easily switched on and off. Starting or reining in a buyback programme is a much less dramatic statement of intent that increasing or cutting a dividend.

Source: Company accounts
“A buyback does make sense when the shares are trading well below their tangible book – or net asset value (NAV) figure of 269p. However, investors could be forgiven for asking why a buyback will do the share price much lasting good this time around, when £18.3 billion of share repurchases (including those for Treasury share transactions) since January 2010 have offered no long-term support to the share price at all - Barclays’ market cap is now just £26 billion.

Source: Company accounts
“This suggests that buybacks are not necessarily going to be seen as the show of confidence that management is hoping to offer. In the end, Barclays will still face several major challenges, as and when the pandemic is beaten off and the economy starts to show some momentum.
“Global indebtedness has gone up over the past year, from already uncomfortable levels, to suggest that growing loan books may not be easy. Those firms or individuals who are not already up to the gills in debt may have no need or desire to start borrowing, while those who are in trouble and may need to keep borrowing represent potentially high-risk propositions.
“Net interest margins remain under pressure, from record-low interest rates and Quantitative Easing, as central banks manipulate yield curves and try to keep them as flat as they can. That may help borrowers manage their interest costs, but it squashes the margin on banks’ loan books.

Source: Company accounts
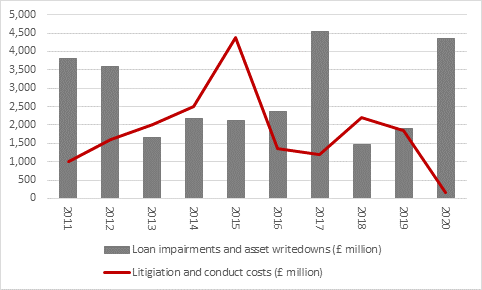
“In addition, banks must confront competition from fintech, digital-only rivals and invest accordingly to meet them head on, while they will also have to contend with ongoing regulatory scrutiny. Litigation and conduct costs came right down in 2020, in the wake of the final Payment Protection Insurance compensation payments (only for loan impairment charges to then soar because of the pandemic). If the banks can keep their noses clean and the economy recovers, that could at least provide some sort of kicker to earnings in the coming year or two.
Source: Company accounts
“Investment banking could also be a source of growth, although this is a high-risk, high-reward business which is cyclical and volatile. Barclays’ corporate and investment banking operations had a good 2020, as financial markets boomed, but every boom is followed by a bust, so nothing can be taken for granted. And when the inevitable bust comes, Mr Edward Bramson of Sherborne Investors, will doubtless look to make his presence felt once more by questioning both the role of the investment bank within Barclays and the amount of capital allocated to it by management.
“Taking global indebtedness, margin pressure, fintech competition, regulation and the fickle nature of investment banking into account, growth could be hard to come by. Barclays therefore needs to offer a decent yield to compensate for that. A payment of a penny a share is a step in that direction but more may be needed to lure back investors who have deserted the bank in the wake of the Great Financial Crisis and missed nothing in terms of share price performance.
“The Prudential Regulatory Authority’s insistence that banks must pay dividends from money earned and not balance sheet reserves is going to be a factor here. Lower loan impairments should help to support profits and improve return on equity, which at 3.2% hardly set the world alight in 2020, and higher returns on equity would focus attention on how the shares trade at just 0.55 times book value, a figure which does at least suggest expectations are low and the shares could be a cheap, should earnings improve and the dividend start to grow.
| P/E 2021E | Price/book Q4 2020 | Dividend yield 2021E | Dividend cover 2021E | |
|---|---|---|---|---|
| HBSC | 19.5 x | 0.73 x | 4.1% | 1.25 x |
| Lloyds | 12.7 x | 0.73 x | 5.3% | 1.50 x |
| NatWest Group | 27.8 x | 0.66 x | 6.3% | 0.57 x |
| Standard Chartered | 11.8 x | 0.52 x | 3.1% | 2.76 x |
| Barclays | 10.8 x | 0.55 x | 3.7% | 2.54 x |
Source: Company accounts, Marketscreener, consensus analysts’ forecasts
“Barclays has now set the bar for the other four FTSE 100 banks when they come to report their dividends for 2020 and perhaps give guidance on their capital return plans for 2021. It will be interesting to see if they all toe a similarly cautious line, especially as Barclays’ shares are taking a hit.
Dividend per share
| 2018 | 2019 | 2020E | 2021E | 2022E | |
|---|---|---|---|---|---|
| Barclays (p) | 6.5p | 3.0p | 1.0p | 5.4p | 7.7p |
| HBSC (USc) | 51c | 30c | 13c | 24c | 30c |
| Lloyds (p) | 3.21p | 1.12p | 1.0p | 2.0p | 2.0p |
| NatWest (p) | 5.5p | 2.0p | 4.0p | 11.0p | 14.0p |
| Standard Chartered (USc) | 21.0c | 7.0c | 11.0c | 21.0c | 29.0c |
Source: Company accounts, Marketscreener, consensus analysts’ forecasts. Barclays’ 2020 dividend payment as declared on 18 February. Ordinary dividends only. Barclays, Lloyds and NatWest in pence, HSBC and Standard Chartered in US cents. NatWest paid special dividends of 7.5p in 2018 and 12.0p in 2019.
These articles are for information purposes only and are not a personal recommendation or advice.
Related content
- Thu, 18/04/2024 - 12:13
- Thu, 11/04/2024 - 15:01
- Wed, 03/04/2024 - 10:06
- Tue, 26/03/2024 - 16:05
- Wed, 20/03/2024 - 16:30