Archived article
Please note that tax, investment, pension and ISA rules can change and the information and any views contained in this article may now be inaccurate.

Politics
Donald Trump continues to contest November’s election result but without much success at either state or Supreme Court level. He is unlikely to go quietly into the night but December’s Electoral College vote in favour of Joe Biden, by a score of 306-232, puts the Democrat in pole position for inauguration day on 20 January 2021.
Intriguingly, American equities, as benchmarked by the Dow Jones Industrials, have done better in the first year, and overall term, of Democrat Presidents rather than Republican ones. The average gain under a Democrat in year one is 13.1% and of the eight post-war Democratic Presidential terms, only Jimmy Carter’s offered investors a loss in its first year.
Markets are now awaiting what the Biden-Harris administration may offer by way of key policies, although how much they can achieve may depend upon the run-off in Georgia for two Senate seats on 5 January. A Democrat sweep would leave the Senate split at exactly 50 seats apiece and give Vice President Harris the casting vote.
US equities have tended do well in the first year of a Democratic Presidency
| Inauguration | President | Party | Change in Dow Jones, Year 1 | Change in Dow Jones, Term | House of Representatives, Year 1 | Senate, Year 1 |
|---|---|---|---|---|---|---|
| 20-Jan-49 | Harry S. Truman | Democrat | 13.6% | 60.8% | Democrats | Democrats |
| 20-Jan-53 | Dwight D. Eisenhower | Republican | 0.4% | 65.8% | Republicans | Republicans |
| 20-Jan-57 | Dwight D. Eisenhower | Republican | (6.3%) | 32.9% | Democrats | Democrats |
| 20-Jan-61 | John F. Kennedy * | Democrat | 10.5% | 41.1% | Democrats | Democrats |
| 20-Jan-65 | Lyndon B. Johnson | Democrat | 10.3% | 4.0% | Democrats | Democrats |
| 20-Jan-69 | Richard M. Nixon | Republican | (16.5%) | 10.0% | Democrats | Democrats |
| 20-Jan-73 | Richard M. Nixon ** | Republican | (16.6%) | (6.5%) | Democrats | Democrats |
| 20-Jan-77 | Jimmy Carter | Democrat | (19.0%) | (0.9%) | Democrats | Democrats |
| 20-Jan-81 | Ronald Reagan | Republican | (11.0%) | 29.1% | Democrats | Republicans |
| 20-Jan-85 | Ronald Reagan | Republican | 24.6% | 82.1% | Democrats | Republicans |
| 20-Jan-89 | George H. W. Bush | Republican | 19.8% | 45.0% | Democrats | Democrats |
| 20-Jan-93 | Bill Clinton | Democrat | 20.0% | 111.1% | Democrats | Democrats |
| 20-Jan-97 | Bill Clinton | Democrat | 15.0% | 54.7% | Republicans | Republicans |
| 20-Jan-01 | George W. Bush | Republican | (7.7%) | (1.1%) | Republicans | Democrats |
| 20-Jan-05 | George W. Bush | Republican | 1.9% | (24.1%) | Republicans | Republicans |
| 20-Jan-09 | Barack Obama | Democrat | 33.4% | 71.7% | Democrats | Democrats |
| 20-Jan-13 | Barack Obama | Democrat | 20.6% | 45.3% | Republicans | Democrats |
| 20-Jan-17 | Donald J. Trump *** | Republican | 31.5% | 50.6% | Republicans | Republicans |
| 20-Jan-21 | Joseph R. Biden | Democrats | TBC | |||
| Average | 6.9% | 37.3% | ||||
| Average – Democrat | 13.1% | 48.5% | ||||
| Average - Republican | 2.0% | 28.4% |
Source: Refinitiv data.
* John F. Kennedy assassinated November 1963 and replaced by Lyndon B. Johnson.
** Richard M. Nixon resigned August 1974 and replaced by Gerald R. Ford.
*** Donald J. Trump data as of 14 December 2020
Economics
Like most economies in the world in 2020, America has suffered a deep shock in the wake of the pandemic, although the damage so far has been less than that seen elsewhere: output fell just 9% in Q2 and 2.9% in Q3, on a year-on-year basis, compared to plunges of 21.5% and 9.6% in the UK. As elsewhere the Government provided fiscal support, with a wide array of welfare and business-oriented schemes, and the central bank did its bit, slashing interest rates and keeping monetary policy ultra-loose, as Federal Reserve chair Jay Powell sanctioned ongoing Quantitative Easing.
US Federal Reserve continues to run ultra-loose monetary policy
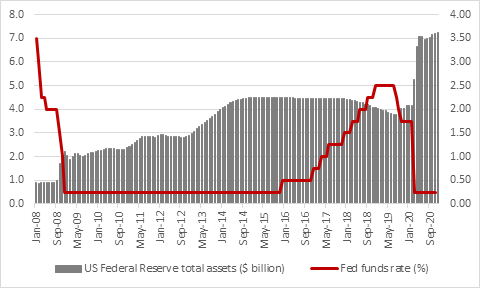
Source: FRED – St. Louis Federal Reserve, Refinitiv data
The assets on the Fed’s balance sheet stand a new record high, as does Federal debt. The two trends are inter-linked and further deficit accumulation seems certain. Granted, there is fierce, bi-partisan debate over proposed a new fiscal stimulus programme but the argument centres over only how much should be spent. Initial calls for a $1.8 trillion plan have been scaled back to $708 billion, albeit without any agreement.
It took America from 1776 to 2010 to accumulate a $13.5 trillion federal deficit. It has taken it just ten years to double that figure, so both the direction of travel and accelerating pace of debt accumulation seem clear.
Surging Federal deficit signals needs for lower interest rates for longer

Source: FRED – St. Louis Federal Reserve, Refinitiv data
Rising federal borrowing will limit the Fed’s ability to raise interest rates, should it feel the need, although at the annual central bank symposium at Jackson Hole, Wyoming in the summer, Mr Powell intimated the Fed would be willing to allow inflation to overshoot and let the economy run hot – at least, if it got the chance. The danger is that a prolonged pandemic, for which America’s libertarian ideals and costly, private healthcare system may not be ideally suited, could crimp growth and the employment outlook for some time.
The good news is that America has recovered from the shattering 20.8 million jobs losses of April. The bad is that job creation has slowed as fresh waves of the pandemic have developed and more lockdowns have been imposed.
US jobs recovery has slowed as the virus has spread and fresh lockdowns been imposed
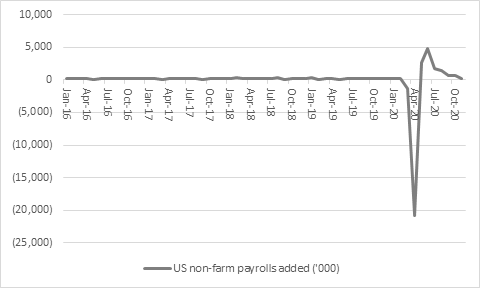
Source: US Bureau of Labor Statistics
Such demand-side destruction could crimp inflation, although rising oil prices, a low base next April and possible supply-side destruction due to fractured global supply chains, increased economic nationalism and the need to rebuild more expensive local supply networks could yet mean rising inflation is a game-changer for markets in the 2020s, just as its absence was in the 2010s.
For the moment, markets are pricing in an inflation rate of just 1.92% in five years’ time, bang in line with the central bank’s 2% target, but expectations do seem to be creeping higher.
US inflation expectations are creeping higher

Source: FRED – St. Louis Federal Reserve database
Markets
The debate over inflation, disinflation, deflation or stagflation is not an academic one and it has potentially huge implications for US equities, which outperformed yet again in 2020, ranking third in total-return, sterling terms out of the eight options available to investors.
America ranked third out of the eight available major geographies in 2020

Source: Refinitiv data. Total returns in sterling terms from 1 Jan 2011 to 9 Dec 2020
In the past decade of low growth, low inflation and zero interest rates, investors have preferred long-dated assets, buy bonds, buy equity growth (such as tech) at the expense of commodities, ‘value’ or cyclical stocks and emerging markets.
The return of inflation would mean that playbook might have to be flipped on its head, while cash would also become a bit of hot potato, as inflation erodes its purchasing power. And the US is so heavily exposed to technology and growth stocks, it might seem logical to expect a premium of American stock market outperformance to come to an end. The six big tech names – Facebook, Alphabet, Amazon, Apple, Netflix and Microsoft – have added $2.1 trillion in market cap over the past year, or two thirds of the S&P’s total value gain.

Source: Refinitiv data
Inflation (besides an energy crisis, a recession and increased geopolitical tensions between America and the USSR) was one reason why US equities did so poorly under President Carter between 1977 and 1981. Even if US stocks are supported by Fed money printing, the last decade’s winners are by no means certain to lead the way. If we get low growth, low inflation or disinflation and low rates tech and growth may again dominate the sector and style charts.
But cyclical growth – or ‘value’ – has already been outperforming tech and secular growth very gently since July. This can be measured by gauging the performance of two exchange-traded funds (ETFs) in the USA, the QQQ Invesco Trust, which follows the price of the biggest non-financial stocks on the NASDAQ, and the Russell 2000 Value ETF.
While the second-half reversal from growth to value may be a surprise to some, it might not be over, if inflation does heat up. The violent manner in which tech and growth fell from favour and value returned to it once the tech bubble peaked in 2000 is a warning against complacency to all technology investors, even if their fortunes as companies still seem incredibly strong, despite gathering regulatory pressure.

Source: Refinitiv data
Read more from our World Investment Outlook 2020 series:
World Investment Outlook – Chapter one: UK
World Investment Outlook – Chapter two: USA
World Investment Outlook – Chapter three: Europe
World Investment Outlook – Chapter four: Emerging Markets
World Investment Outlook – Chapter five: Asia
World Investment Outlook – Chapter six: Japan
These articles are for information purposes only and are not a personal recommendation or advice. Past performance is not a guide to future performance and some investment need to be held for the long term.

Written by:
Russ Mould
Russ Mould has 28 years' experience of the capital markets. He started at Scottish Equitable in 1991 as a fund manager and in 1993 he joined SG Warburg, now part of UBS investment bank, where he worked as equity analyst covering the technology sector for 12 years. Russ joined Shares in November 2005 as technology correspondent and became Editor of the magazine in July 2008. Following the acquisition of Shares' parent company, MSM Media by AJ Bell Group, he was appointed AJ Bell’s Investment Director in summer 2013.
Related content
- Wed, 17/04/2024 - 09:52
- Tue, 30/01/2024 - 15:38
- Thu, 11/01/2024 - 14:26
- Thu, 04/01/2024 - 15:13
- Fri, 17/11/2023 - 08:59