Archived article
Please note that tax, investment, pension and ISA rules can change and the information and any views contained in this article may now be inaccurate.
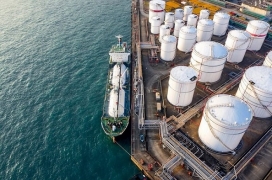
While the stunning collapse of the price of West Texas Intermediate oil for May delivery has got markets in a tizzy, shrewd investors will be looking to see if there is an angle for them and it may just come in the form of oil tankers.
If the black stuff cannot be stored on land then it will have to sit at sea or be slowly transported by water and it is therefore intriguing to see shipbroker Clarkson flag strength in the oil tanker market in its otherwise cautious trading outlook.
Rates for Very Large Crude Carriers, which can carry up to two million barrels of oil, Ultra Large Crude Carriers (four million), Aframax and Suezmax vessels have shot up this year.

Source: Refinitiv data
VLCC rates on certain routes stand at $139,000 a day and the average so far in 2020 has been $98,000 a day compared to $67,000 in 2019. Storage is one factor behind this and the Saudi Arabian fleet of 20 VLCCs that is reportedly bearing 40 million barrels of oil from the Gulf to the USA is another.
On top of those demand-boosting factors come two issues that are restraining supply. Fallow years for vessel owners have seen a plunge in profits and even losses, limiting their appetite to expand fleets, while IMO 2020 emissions rulings are putting a cap on newbuilding activity and even leading to the decommissioning of older vessels which either won’t meet the regulations or are uneconomic to run under them.

Source: Clarkson, Euronav
Tanker stocks are starting to take notice. Unfortunately the US-listed Invesco Shipping ETF, which gloried in the stock ticker of SEA, ceased to trade in February as investors finally gave up on the sector after years of terrible performance (a bullish signal if ever there was one) – the seven tanker stocks for example made just $397 million in net profit between them in 2019, compared to $1.5 billion in 2015.

Source: Refinitiv data
However, brave, risk-tolerant portfolio builders can still directly access individual tanker stocks, seven of which trade on the New York Stock Exchange. The share prices of all sank initially during the broader market panic in late February and early March but all have come roaring back as daily rates have more than doubled and nearly trebled.
| Share price change | 1 year | 6 months | 3 months | 1 month | 23-Mar-20 | 1 week |
|---|---|---|---|---|---|---|
| Scorpio Tankers | (2.1%) | (33.0%) | (28.1%) | 65.9% | 46.3% | 37.5% |
| Teekay | (12.7%) | (8.2%) | (19.5%) | 78.6% | 78.6% | 35.1% |
| Nordic American | 134.1% | 20.0% | 3.7% | 95.1% | 89.0% | 28.3% |
| Frontline | 39.4% | 1.3% | (12.6%) | 69.6% | 61.3% | 23.0% |
| Euronav | 23.8% | 4.9% | 0.3% | 41.8% | 38.5% | 18.3% |
| DHT | 66.0% | 13.4% | 8.5% | 47.4% | 38.6% | 24.2% |
Source: Refinitiv data
The carnage in the oil market is still therefore spawning investment winners elsewhere and the maths remains compelling, even after the tankers owners’ share price gains, using Scorpio Tankers as an example.

Source: Refinitiv data
As of the end of 2019, Scorpio owned 137 ships with a stated value of $4 billion. That is an average value of just under $30 million per vessel – vessels which can in some cases command $139,000 a day now to ship oil around the globe, or $50 million a year in revenues. That should mean a profit bonanza especially as Scorpio has funded its assets broadly 50-50 between equity and debt so the returns will be heavily geared up.
There are clear risks, notably the debt and leases that tanker owners use to fund their operations and the ebbs and flows of the global oil market and world trade, all of which mean this is in many ways the ultimate boom-and-bust industry, even before we get to the building cycle for new ships. Profits soar when daily rates rise but collapse when they fall, thanks to the fixed costs involved and especially the interest and lease payments that owners must meet on their liabilities.
But even after their latest surge the tanker stocks trade on barely one times historic book value when they could be on the verge of colossal profits, thanks in part to the oil market’s unprecedented woes. That may offer some downside protection while still leaving plenty of room for upside if daily shipping rates remain firm.
| Share price ($) | Market cap ($m) | 2019 Vessel value ($m) | 2019 Net debt ($m) | 2019 Book value ($m) | 2019 Revenues ($m) | 2019 Net profit ($m) | 2019 P/E | 2019 Price/book | |
|---|---|---|---|---|---|---|---|---|---|
| Teekay | 3.93 | 396 | 1,750 | 936 | 990 | 944 | 41 | 9.6 x | 0.40 x |
| Scorpio | 23.38 | 1,372 | 4,008 | 2,920 | 1,977 | 704 | (50) | loss | 0.69 x |
| SFL | 10.15 | 1,212 | 2,119 | 2,515 | 1,107 | 459 | 89 | 13.6 x | 1.09 x |
| Euronav | 11.77 | 2,590 | 3,177 | 1,408 | 2,312 | 932 | 112 | 23.1 x | 1.12 x |
| Nordic American | 4.8 | 707 | 900 | 327 | 595 | 317 | (10) | loss | 1.19 x |
| DHT | 8.15 | 1,198 | 1,589 | 784 | 932 | 535 | 74 | 16.2 x | 1.28 x |
| Frontline | 10.82 | 2,139 | 2,580 | 879 | 1,510 | 957 | 140 | 15.3 x | 1.42 x |
| Aggregate | 9,613 | 16,124 | 9,769 | 9,424 | 4,848 | 397 | 24.2 x | 1.02 x |
Source: Company accounts, Refinitiv data
These articles are for information purposes only and are not a personal recommendation or advice.

Written by:
Russ Mould
Russ Mould has 28 years' experience of the capital markets. He started at Scottish Equitable in 1991 as a fund manager and in 1993 he joined SG Warburg, now part of UBS investment bank, where he worked as equity analyst covering the technology sector for 12 years. Russ joined Shares in November 2005 as technology correspondent and became Editor of the magazine in July 2008. Following the acquisition of Shares' parent company, MSM Media by AJ Bell Group, he was appointed AJ Bell’s Investment Director in summer 2013.
Related content
- Wed, 17/04/2024 - 09:52
- Tue, 30/01/2024 - 15:38
- Thu, 11/01/2024 - 14:26
- Thu, 04/01/2024 - 15:13
- Fri, 17/11/2023 - 08:59