Archived article
Please note that tax, investment, pension and ISA rules can change and the information and any views contained in this article may now be inaccurate.
“In the long run, share prices and company valuations are dictated by profits and cash flow, but sentiment and narrative can dominate in the short term. And one way that investors can judge sentiment is to look at a price chart, as that is the perfect summary of market opinion at any one given time,” says Russ Mould, AJ Bell Investment Director.
“In that context, the current chart of the FTSE 100 will be as instructive, especially by technical analysts, who prefer to use charts as a key basis for their trades, rather than fundamental analysts who go by long-term profit and cash flow analysis when it comes to their investments.
“This is because the FTSE 100’s first major rally after its February-March collapse began at 4,994 on 23 March and peaked at 5,816, just three days later. The index then retrenched and its next upward surge reached 5,843 on 9 April before seemingly running out of puff.
“Technical analysts will fear this is a critical failure to break-out and smash the classic bear-market pattern of a series of lower highs and lower lows on the index. If the chartists are right (and fundamentalists will dismiss this as mere voodoo) then there is a danger the FTSE 100 could even retest that March low of 4,994. If that holds, then a bottom just might be in place. If not, there could be further near-term downside.

Source: Refinitiv data
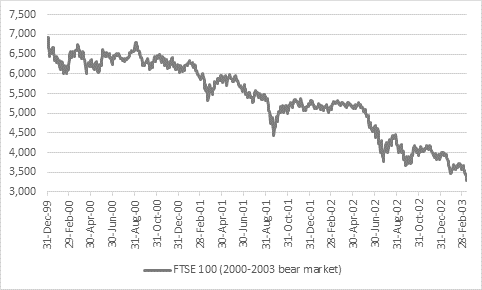
“That dreaded pattern of lower highs and lower lows was in evidence during the long bear markets of 2000-03 and 2000-07.
“In the case of the former, seven rallies failed to break the downdraft, even though they represented an aggregate gain of 4,590 points. The index registered a peak-to-trough loss of 3,643 points as it plunged from 6,930 on 31 December 1999 to 3,287 despite those ferocious surges.
Source: Refinitiv data
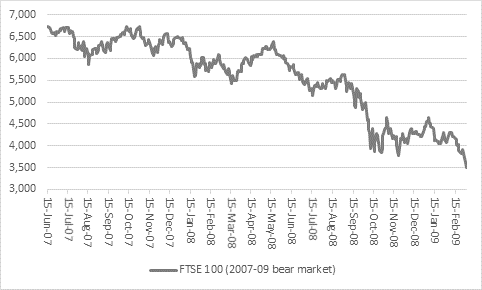
“During the bear run that featured the Great Financial Crisis and a deep recession, nine rallies failed to break the downward trend, even though they represented an aggregate gain of 5,853 points. Overall the index registered a peak-to-trough loss of 3,220 points as it plunged from 6,732 on 31 December 1999 to 3,512, despite those advances.”
Source: Refinitiv data
These articles are for information purposes only and are not a personal recommendation or advice.
Related content
- Wed, 24/04/2024 - 10:37
- Thu, 18/04/2024 - 12:13
- Thu, 11/04/2024 - 15:01
- Wed, 03/04/2024 - 10:06
- Tue, 26/03/2024 - 16:05