Archived article
Please note that tax, investment, pension and ISA rules can change and the information and any views contained in this article may now be inaccurate.

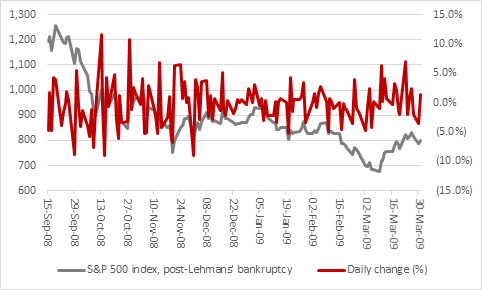
While investors will be taking heart from Tuesday’s double-digit percentage rally in America’s S&P 500 index they will also be aware that such volatility does not usually call a market bottom. The day-to-day swings in the S&P 500 are currently exceeding those seen in the days and weeks after the collapse of Lehman Brothers on 15 September 2008 as the financial crisis reached its height.

Source: Refinitiv data
And although September and October 2008 saw huge rallies, America’s headline stock index did not bottom until March 2009, by which time it had fallen by 43% since Lehman’s collapse. As the index started to reach the bottom, trading became less frenzied as despondency gathered and investors finally throw in the towel.
Source: Refinitiv data
A period of calm, even resignation, might not be a bad thing and chasing a market after it has just surged by 11% in a day is a risky strategy. For those who are prepared to take a contrarian view and start buying, then it would surely be better to do it after bad days of heavy falls than good days of big gains.
One thing that will encourage contrarians is the elevated readings on the VIX index, the so-called fear index.
The VIX was launched in 1990 and it has averaged a reading of 19 over its history, with a low of 9.1 in November 2017 and an all-time high of 82.69 last week (16 March).
The VIX hit its low as a bull-market was in full flow. It reached its prior peak of 80.86 in November 2008 when bears were in charge and share prices were plunging in the wake of Lehman Brothers’ failure.
It is tempting to think that the VIX may be more useful as a contrarian indicator than as a lead indicator – after all, to repeat one of Warren Buffett’s mantras, investors should look to be ‘fearful when others are greedy and greedy when others are fearful.’
The VIX has moved above 40, more than twice its historic average, just twelve times, including an 18-day streak since 6 March.
Analysis of how the VIX performed in the run-up to a move above that 40 mark shows that markets have already begun to fall and fall hard by the time fear really takes over. Note how the S&P 500 lost more than a fifth of its value in the six months preceding a reading of 40 four times out of twelve. In fact what is odd about the two occasions this year is how calm markets were beforehand, perhaps because the viral outbreak was just impossible to forecast.
Note also how markets tend to rally after the VIX hits 40, to again support the thesis that it is a contrarian indicator and back up Buffett’s aphorism. Indeed, after a move above 40, the VIX tends to peak on average barely 20 days later, to suggest that by the time the VIX hits this mark the worst may already be behind us.
| Change in S&P 500 before VIX hits 40 | Change in S&P 500 after VIX hits 40 | ||||||||
|---|---|---|---|---|---|---|---|---|---|
| 6 months | 3 months | 1 month | 1 week | 1 week | 1 month | 3 months | 6 months | 12 months | |
| 31-Aug-98 | (8.6%) | (12.3%) | (14.6%) | (12.0%) | 1.7% | 6.2% | 21.6% | 29.1% | 37.9% |
| 17-Sep-01 | (11.3%) | (14.0%) | (10.6%) | (4.9%) | (3.4%) | 3.7% | 9.2% | 12.2% | (15.9%) |
| 02-Aug-02 | (23.0%) | (19.5%) | (9.4%) | 1.3% | 5.1% | 6.0% | 4.2% | (1.0%) | 13.4% |
| 19-Sep-02 | (26.9%) | (16.2%) | (10.0%) | (4.9%) | 1.4% | 4.9% | 4.9% | 3.8% | 22.9% |
| 29-Sep-08 | (16.4%) | (13.6%) | (13.8%) | (8.3%) | (4.5%) | (15.9%) | (21.4%) | (28.8%) | (4.1%) |
| 07-Jan-09 | (27.2%) | (7.9%) | (0.3%) | 0.4% | (7.1%) | (4.2%) | (9.0%) | (3.0%) | 25.9% |
| 06-Apr-09 | (20.9%) | (9.9%) | 22.3% | 6.1% | 2.8% | 10.1% | 7.6% | 24.5% | 42.4% |
| 20-May-10 | (2.1%) | (3.2%) | (11.2%) | (7.4%) | 2.9% | 4.3% | 0.4% | 11.7% | 24.4% |
| 10-Aug-11 | (15.2%) | (16.5%) | (15.1%) | (11.1%) | 6.5% | 3.0% | 9.7% | 20.5% | 25.2% |
| 24-Aug-15 | (10.3%) | (11.0%) | (9.0%) | (10.0%) | 4.2% | 2.4% | 9.0% | 2.8% | 15.5% |
| 28-Feb-20 | 0.9% | (5.9%) | (9.8%) | (11.5%) | (1.7%) | ||||
| 06-Mar-20 | (2.5%) | (7.7%) | (12.9%) | (1.7%) | (6.6%) | ||||
| Average | (13.6%) | (11.5%) | (7.9%) | (5.3%) | 0.1% | 2.0% | 3.6% | 7.2% | 18.8% |
Source: Refinitiv data
However, as with any trends there are exceptions to the rule. The S&P was lower still 12 months after the 40 mark was crossed in 2001 as the tech bubble burst and 12 months after it got there in September 2008. In both cases, there were two factors at play:
- a lengthy recession
- valuations that peaked at historically lofty levels
The first of those two pre-conditions for an extended period of volatility is now seen as a clear possibility and the second was already there, looking at ratios such as market cap to GDP and Professor Robert Shiller’s cyclically adjusted price earnings (CAPE) analysis.
This cautions against too much gung-ho buying and perhaps a patient approach, putting money into the market after its bad days rather than its good ones, in the knowledge you are never going to actually call the bottom to the day.
The other thing to consider is that there is another asset class which seems to thrive when the VIX is elevated and fear is in charge of markets rather than greed – and that is gold.
Only in one of ten occasions before 2020 when the VIX hit 40 has gold failed to gain on a 12-month view, and that was 2011, amid the European debt crisis and the flap caused by the downgrade of America’s sovereign debt.
| Change in gold before VIX hits 40 | Change in gold after VIX hits 40 | ||||||||
|---|---|---|---|---|---|---|---|---|---|
| 6 months | 3 months | 1 month | 1 week | 1 week | 1 month | 3 months | 6 months | 12 months | |
| 31-Aug-98 | (8.2%) | (4.9%) | (4.6%) | (3.5%) | 4.8% |
7.2% | 6.3% | 3.9% | (7.3%) |
| 17-Sep-01 | 10.7% | 6.3% | 4.2% | 6.5% | (0.4%) |
(2.5%) | (4.0%) | 1.0% | 9.4% |
| 02-Aug-02 | 7.6% | (1.8%) | (2.2%) | 0.3% | 2.9% |
2.5% | 4.3% | 20.5% | 15.9% |
| 19-Sep-02 | 10.0% | (0.3%) | 4.6% | 1.4% | (1.1%) |
(3.3%) | 7.2% | 3.9% | 18.4% |
| 29-Sep-08 | (3.7%) | (2.6%) | 7.6% | 0.4% | (3.9%) |
(15.8%) | (2.0%) | 3.2% | 10.3% |
| 07-Jan-09 | (8.6%) | (6.7%) | 9.5% | (1.8%) | (4.1%) |
7.8% | 4.7% | 9.2% | 34.4% |
| 06-Apr-09 | 0.8% | 2.4% | (7.7%) | (6.1%) | 1.0% |
4.3% | 7.2% | 15.2% | 30.7% |
| 20-May-10 | 4.7% | 6.1% | 4.2% | (4.0%) | 2.2% |
5.9% | 3.8% | 13.9% | 26.8% |
| 10-Aug-11 | 30.4% | 17.7% | 15.0% | 6.6% | 0.3% |
4.4% | 0.7% | (2.4%) | (9.2%) |
| 24-Aug-15 | (3.5%) | (3.8%) | 7.0% | 3.7% | (2.5%) |
(2.9%) | (7.0%) | 6.4% | 16.7% |
| 28-Feb-20 | 5.6% | 8.2% | 1.2% | (3.4%) | 5.1% |
||||
| 06-Mar-20 | 10.6% | 13.7% | 7.1% | 5.1% | (8.2%) |
||||
| Average | 4.7% | 2.9% | 3.8% | 0.4% | (0.3%) | 0.8% | 2.1% | 7.5% | 14.6% |
Source: Refinitiv data
These articles are for information purposes only and are not a personal recommendation or advice.

Written by:
Russ Mould
Russ Mould has 28 years' experience of the capital markets. He started at Scottish Equitable in 1991 as a fund manager and in 1993 he joined SG Warburg, now part of UBS investment bank, where he worked as equity analyst covering the technology sector for 12 years. Russ joined Shares in November 2005 as technology correspondent and became Editor of the magazine in July 2008. Following the acquisition of Shares' parent company, MSM Media by AJ Bell Group, he was appointed AJ Bell’s Investment Director in summer 2013.
Related content
- Wed, 17/04/2024 - 09:52
- Tue, 30/01/2024 - 15:38
- Thu, 11/01/2024 - 14:26
- Thu, 04/01/2024 - 15:13
- Fri, 17/11/2023 - 08:59