Archived article
Please note that tax, investment, pension and ISA rules can change and the information and any views contained in this article may now be inaccurate.
“You cannot help but get the feeling that the 29 August Payment Protection Insurance claims deadline cannot come quick enough for the big banks, especially as Lloyds has just taken an extra £550 million provision to try and cover a possible final rash of compensation payments,” says Russ Mould, AJ Bell Investment Director.
“Add that to the gloom cast by CYBG’s third-quarter update, which showed slow loan growth and pressure on net interest margins, and the Metro Bank fiasco and the banks sector remains firmly in investors’ doghouse.
“If there is any good news for Lloyds it is that the challenger banks are finding life every bit as tough as the established players. That has at least helped Lloyds keep the drop in its net interest margin to the bare minimum, from 2.93% a year (and 2.91% in Q1) to 2.89% between April and June.

Source: Company accounts
“However, the shift in central bank policy from interest rate increases to interest rate cuts is not helping here and Lloyds will be watching the Bank of England’s policy announcement on Thursday every bit as closely as bond and stock investors. A shift in bias to cutting interest rates from tightening them could signal more pressure on margins and therefore profits.
“For the moment, however, the greatest damage was done in Q2 by that extra PPI compensation provision and a further £123 million in customer remediation costs. That takes total conduct, litigation and compensation costs to £25 billion since the first PPI charge of £3.2 billion way back in Q1 2011.
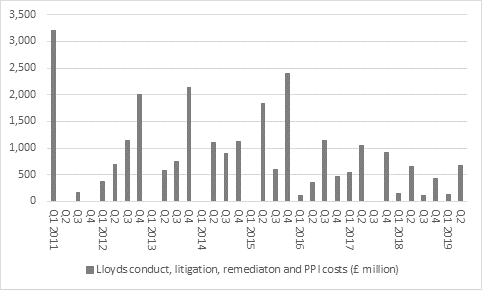
Source: Company accounts
“While restructuring costs were still just £56 million, investors may also be concerned to see an increase in charges for bad loans to £304 million in the second quarter, the highest number since Q2 2014. That raises questions about the UK economy and the health of private and corporate borrowers, so this is a trend that must be watched.
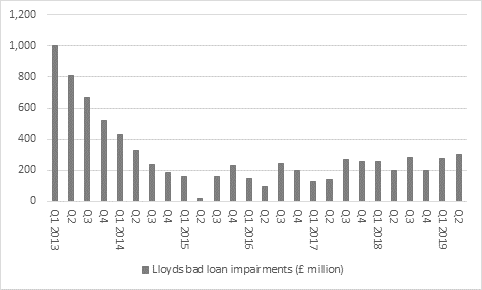
Source: Company accounts
“Stated pre-tax profit fell year-on-year in the second quarter and so did the underlying figure, as loan and deposit growth remained weak. This reflects how the UK banking market remains highly competitive and tightly regulated and also the generally soggy nature of the economy.
“In compensation for these risks, Lloyds does at least offer a prospective dividend yield of more than 6% and the bank offers the second-highest dividend yield among the 51 FTSE 100 companies that offer earnings cover for the dividend of more than 2.0 times.
10 highest yielding FTSE stocks with earnings cover above 2.0 times
| Dividend cover (x) 2019E | Dividend yield (%) 2019E | |
|---|---|---|
| International Cons. Airlines | 3.63 x | 6.50% |
| Lloyds | 2.17 x | 6.10% |
| Micro Focus | 2.07 x | 5.50% |
| Centrica | 1.97 x | 5.50% |
| Royal Bank of Scotland | 2.22 x | 5.40% |
| Kingfisher | 2.00 x | 5.10% |
| Smith DS | 2.19 x | 4.80% |
| Barclays | 2.96 x | 4.70% |
| Anglo American | 2.36 x | 4.20% |
| Mondi | 2.35 x | 3.70% |
Source: Sharecast, consensus analysts’ forecasts, Refinitiv data
“In addition, the shares trade at barely 1.0 times net asset value, so it is possible to make a valuation case for the stock. A conclusion to PPI could help sentiment and any more trouble at its Challenger rivals would not necessarily hurt either but the prevailing low-growth, low-interest-rate environment is not a helpful one for banks’ profits or share prices – and it is starting to look like we could be stuck in that situation for some time to come.”
| P/E 2019E | Price/book 2019E | Dividend yield 2019E | Dividend cover 2019E | |
|---|---|---|---|---|
| HBSC | 11.5 x | 1.21 x | 6.20% | 1.41 x |
| Lloyds | 7.3 x | 1.04 x | 6.20% | 2.22 x |
| Royal Bank of Scotland | 7.9 x | 0.76 x | 5.90% | 2.16 x |
| Standard Chartered | 11.3 x | 0.76 x | 3.10% | 2.89 x |
| Barclays | 7.4 x | 0.59 x | 4.70% | 2.89 x |
Source: Sharecast, consensus analysts' forecasts, company accounts. Price/earnings and yield based on 2019 consensus. Price/book based on last published book value per share figure (Q1 2019 or Q2 2019)
These articles are for information purposes only and are not a personal recommendation or advice.
Related content
- Thu, 18/04/2024 - 12:13
- Thu, 11/04/2024 - 15:01
- Wed, 03/04/2024 - 10:06
- Tue, 26/03/2024 - 16:05
- Wed, 20/03/2024 - 16:30