Archived article
Please note that tax, investment, pension and ISA rules can change and the information and any views contained in this article may now be inaccurate.
“Worries over the housing market and state of the UK economy more generally appear to be trumping the feel-good factor generated by better-than-expected profits and further share buybacks and dividends from high-end house builder Berkeley, even as its full-year results reaffirm three factors that could form an investment case for the stock,” says Russ Mould, AJ Bell Investment Director.
“First, the company has a knack of consistently exceeding its cautious profit forecasts. It has done so again today and some may therefore be tempted to think that Berkeley is low-balling analysts with an estimate that pre-tax profit will drop by a third to around £520 million in the year ahead.

Source: Company accounts, Sharecast, consensus analysts’ forecasts. Financial year to April.
“Second, the firm’s land-buying skills, focus on high-end properties in the South East and operational acumen mean that its operating margins are high, at 26%, and those margins in turn support the cash flow that funds share buybacks and dividends. Their combined value is due to come to £280 million a year until April 2025, a £1.78 billion return on a company whose market capitalisation is £4.6 billion, although the company does caveat this by saying a material change in the operating environment could curtail the cash-return plan.
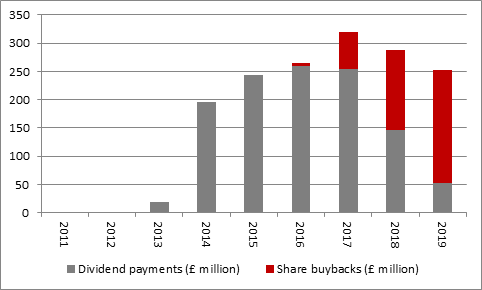
Source: Company accounts. Financial year to April.
“Finally, Berkeley’s nose for, and ability to judge, the house building cycle must be respected. Chairman Tony Pidgley’s reputation rests on his uncanny knack to sell near the top and buy near the bottom, so it is interesting to see the company move beyond its core London market and out into the Home Counties. Eight of the eleven new developments launched in the year to April are based outside of the nation’s capital.
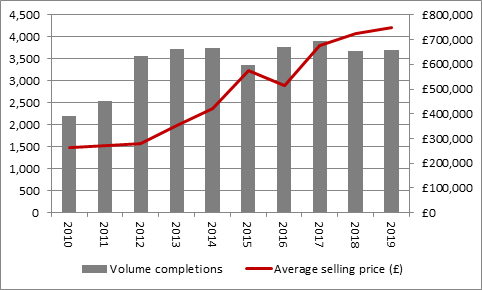
Source: Company accounts. Financial year to April.
“This shift may reflect how completions last year (at 3,698) are no higher now than they were six years ago (3,712 in the year to April 2013). Prices have more than doubled in the interim and the issue of affordability, coupled with wider economic and political concerns, could be holding back volumes and not just at Berkeley, even allowing for how low interest and mortgage rates are and how much support the Government is offering to first-time buyers.
“As a result of these concerns, shares in the big UK house builders have done poorly in the past 12 months, with just Barratt managing a positive capital return.
| Share price return, last 12 months | |
|---|---|
| Barratt Developments | 2.40% |
| Redrow | (8.20%) |
| Crest Nicholson | (11.40%) |
| Berkeley Homes | (15.00%) |
| Taylor Wimpey (UK) | (15.00%) |
| Bellway | (15.60%) |
| Bovis | (16.10%) |
| Countryside Properties | (18.90%) |
Source: Refinitiv data
“What this does mean, however, is that house builders’ shares have derated. Net asset values and profits have (generally) continued to grow and on average the FTSE 100 and FTSE 250 builders now trade on less than 1.5 times historic net asset value per share. That may not be bargain basement territory but it is a lot lower than the two-times-plus multiples that were evident a couple of years ago.
“Meantime, dividend yields remain meaty and as such some investors may take the view that they are at least being paid to wait to find out what happens to the UK housing market in a post-Brexit world, or one where UK interest rates go up consistently or where there is a Labour Government. Others might feel that this string of risks is too great even given the yield rewards on offer, even though the aggregate combined dividend payment for 2019 of £2.3 billion is backed by a combined net cash pile of £3.5 billion.”
| PE (x) 2019E | Dividend yield (%) 2019E | Dividend cover (x) 2019E | Price/NAV(x) Historic | |
|---|---|---|---|---|
| Persimmon | 6.9 x | 12.10% | 1.20 x | 1.90 x |
| Berkeley Homes | 11.5 x | 4.80% | 1.80 x | 1.62 x |
| Countryside Properties | 7.4 x | 4.80% | 2.86 x | 1.62 x |
| Taylor Wimpey | 7.9 x | 11.40% | 1.11 x | 1.61 x |
| Redrow | 6.3 x | 9.60% | 1.65 x | 1.33 x |
| Bovis | 9.5 x | 10.00% | 1.05 x | 1.30 x |
| Barratt Developments | 7.9 x | 8.20% | 1.54 x | 1.26 x |
| Bellway | 6.2 x | 5.40% | 2.97 x | 1.26 x |
| Crest Nicholson | 7.4 x | 9.10% | 1.48 x | 1.08 x |
| Average | 7.9 x | 8.40% | 1.74 x | 1.44 x |
Source: Refinitiv data
These articles are for information purposes only and are not a personal recommendation or advice.
Related content
- Wed, 24/04/2024 - 10:37
- Thu, 18/04/2024 - 12:13
- Thu, 11/04/2024 - 15:01
- Wed, 03/04/2024 - 10:06
- Tue, 26/03/2024 - 16:05