Archived article
Please note that tax, investment, pension and ISA rules can change and the information and any views contained in this article may now be inaccurate.
“After the 5% cut to the interim payment, shareholders in BT could have been forgiven for fearing the worst, so they will be pleasantly surprised to see new chief executive Philip Jansen and the board’s decision to make an unchanged full-year dividend of 15.4p,” says Russ Mould, AJ Bell Investment Director.
“That equates to a 7% dividend yield which may provide some support for the share price, although investors still need to make sure that the payment can be sustained and that BT is not strangling itself so it can avoid a repeat of the dividend cuts of 2002 and 2010.
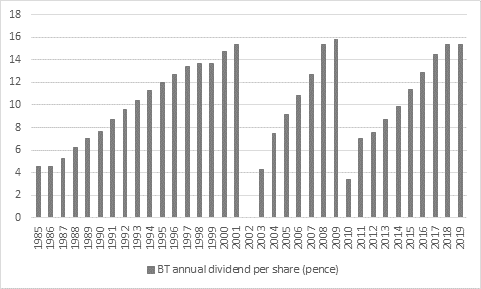
Source: Company accounts
“The good news there is that BT does not appear to be skimping on capital expenditure, as management has suggested that investment in the business will be roughly unchanged this year at £3.8 billion. But the forecast that ‘normalised cash flow,’ as BT defines it, will fall by almost a fifth this year and that its preferred earnings metric, ‘adjusted EBITDA,’ will drop for the third year in a row means investors are likely to remain on edge about the dividend, even if BT is already committing to a further, unchanged 15.4p-per-share distribution this year.
“That is a real danger, given that BT is hemmed in by the regulator on one side and huge number of competitors on the other, including Vodafone, Three, 02, Virgin Media, Talk Talk and the Comcast-owned Sky, to name but a few, across fixed-line, mobile, broadband and content. Customers are quite capable of switching provider if they are unhappy.
“But for the moment BT seems to be coping as it buffers its competitive position with investment in fibre and 5G services and presses ahead with efficiency programmes designed to generate annualised cost savings of £875 million.
“Maintaining the dividend would therefore be a huge step toward perhaps persuading investors that BT could be a cheap stock. At 216p the shares trade on a forward price/earnings ratio of barely eight times and come with a plump yield and the company does feel unloved – its shares trade no higher now than they did in February 1991 and only 10 of the 21 analysts who research the company rate the shares as a ‘buy’.”
| £ million | 2014 | 2015 | 2016 | 2017 | 2018 | 2019 | 2020E* |
|---|---|---|---|---|---|---|---|
| Capex | 2,346 | 2,317 | 2,622 | 3,454 | 3,522 | 3,963 | 3,800 |
| ‘Adjusted’ EBITDA | 6,116 | 6,193 | 6,459 | 7,645 | 7,505 | 7,392 | 7,250 |
| ‘Normalised’ cashflow | 2,450 | 2,830 | 3,098 | 2,782 | 2,973 | 2,400 | 2,000 |
Source: Company accounts. *2020 based on mid-point of management guidance. Financial year to March.
“The fact that investors are demanding a 7% dividend yield to compensate themselves for the risk associated with holding the shares suggests they are still concerned about BT’s trading prospects, following the torrid end to Gavin Patterson’s time in charge, amid profit warnings, an accounting scandal in Italy and a cut to the interim dividend.
“The good news is that BT is still generating enough cash to fund its capital investment needs, pay the interest on its debt and the taxman and still pay the dividend. However, the margin for error is getting smaller and if profits do come under severe pressure then the pay-out could come under threat.
| £ million | 2010 | 2011 | 2012 | 2013 | 2014 | 2015 | 2016 | 2017 | 2018 | 2019 |
|---|---|---|---|---|---|---|---|---|---|---|
| Operating profit | 2,123 | 2,578 | 2,889 | 2,948 | 3,145 | 3,402 | 3,613 | 3,167 | 3,381 | 3,421 |
| Depreciation & amortisation | 3,039 | 2,979 | 2,972 | 2,843 | 2,695 | 2,538 | 2,631 | 3,572 | 3,514 | 3,546 |
| Net working capital | (170) | 13 | -25 | -2 | -302 | -117 | -3 | -112 | -549 | -90 |
| Tax | (232) | -76 | -400 | -64 | -347 | -309 | -256 | -551 | -473 | -431 |
| Net interest expense | -1,158 | -924 | -779 | -772 | -826 | -859 | -712 | -804 | -764 | -756 |
| Capital expenditure | -2,509 | -2,645 | -2,578 | -2,481 | -2,356 | -2,317 | -2,622 | -3,454 | -3,522 | -3,963 |
| Operating free cash flow | 1,093 | 1,925 | 2,079 | 2,472 | 2,009 | 2,338 | 2,651 | 1,818 | 1,587 | 1,727 |
| Dividends | 265 | 543 | 590 | 683 | 778 | 924 | 1,075 | 1,435 | 1,523 | 1,504 |
| OpFcF minus Dividends | 828 | 1,382 | 1,489 | 1,789 | 1,231 | 1,414 | 1,576 | 383 | 64 | 223 |
Source: Company accounts
These articles are for information purposes only and are not a personal recommendation or advice.
Related content
- Wed, 24/04/2024 - 10:37
- Thu, 18/04/2024 - 12:13
- Thu, 11/04/2024 - 15:01
- Wed, 03/04/2024 - 10:06
- Tue, 26/03/2024 - 16:05